In order to provide a more tailored and simplified option of viewing/comparing data, Uncountable created the Experiment Lists, which acts like a pivot table on all of the experiments a user has access to, including across Material Families and across Projects. Users can select exactly what information they would like presented in the table, export it, and use the quick links in the table to access the underlying data in more detail.
To access the Experiments List view, you can either navigate to it via the Project Dashboard here:

Or by accessing the dedicated page here:

Once you’ve navigated to the Experiments List page, you can start to use various filter and search components. In the image below, Object A represents a quick filter that can be used to limit the displayed results to either Experiments that are only in “This Project” or “This Material Family”, which can be helpful if you are trying to keep your search very broad, as the Experiment List view can be used to show results across Material Families and Projects. Object B enables the user to add specific filters for various components of an Experiment. Object C is a Search Bar that will filter the list of Experiments based on their Experiment Name. Object D allows the user to customize the table view itself, including adjusting which columns are displayed and in which order, exporting the table to CSV, and loading presets.

The filters that users can add start with the idea that there is a “Group” that must be chosen to limit the “What” options. Group options include the following:

So if the user wants to use this table to act as a “Where Used” function, they can filter for Group = Experiment Ingredient and then type to select the ingredient of their choosing. Note that once a user selects an ingredient (here Carbon Black C, found by typing in the first characters to limit the list and then selecting my desired ingredient from the shortened list), the filter will default to use an “Exists” relationship, but you can select other options like “Does Not Exist” , or >, <, =, and others. If you select a quantitative filter, the number you will be filtering upon will be the user entered value, usually parts or mass units (grams/lbs). If you wish to see or filter upon a calculated value, you can select that option in the dropdown that appears below the ingredient name. For example, by selecting % from the dropdown, a user can filter by the weight % of an ingredient in an Experiment instead of by the raw weight of the ingredient in the Experiment. Note that in the Experiments List view, the amounts of all ingredients are summed up across the steps of an Experiment, so if the ingredient is used multiple times in an Experiment, the system will automatically sum all of the values together.

Users can also add filters for metadata, measurements, process parameters, and calculations (like Formula Cost or % Weight Solids) by selecting the corresponding Group in the filtering options.
Once a user has selected a filter for any component, they can easily add that component value as a column to the table by selecting the “+” button below.

In the example above, the user is presented with a table that lists the Experiment name, 2 dates for the experiment, and then the amount of the ingredient that they filtered for. The user now has a simplified list of experiments that presents only the important summary information that the user wants displayed. Any measurement, or calculation, or metadata field can also be filtered for and displayed in this table.
**Note, the filters and the columns are not 1:1 linked, for there are certain circumstances where a user may want to filter Experiments for a certain value, but not present that value in the table itself, and vice versa for a column.**
Once a column is added to a table, it can easily be used to sort the order of entries in the table, as well as remove it or add it as a filter. These options all exist by clicking on the column header.

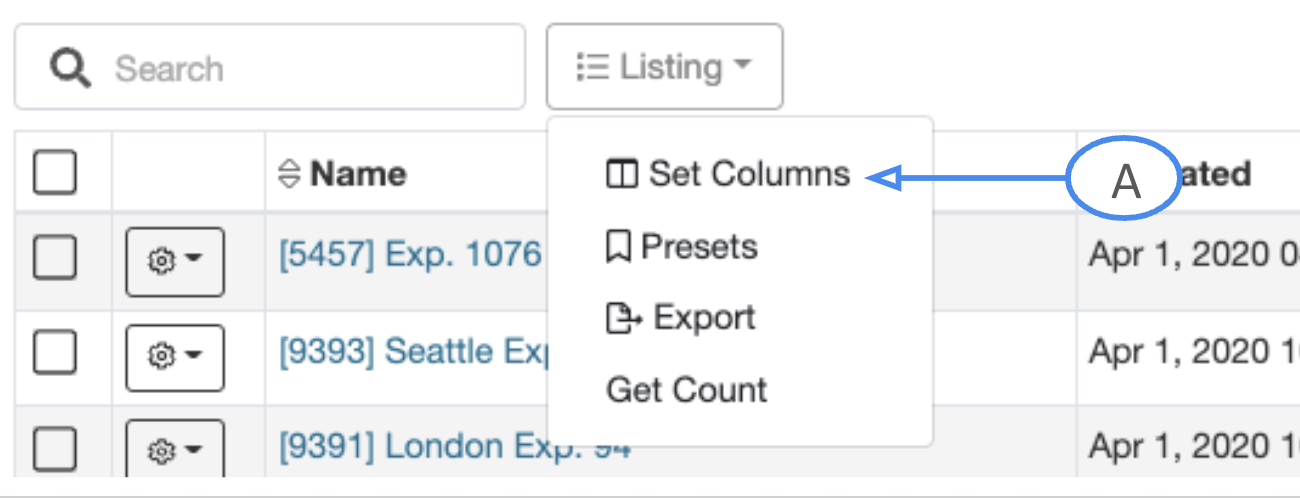
If users want to adjust the table beyond adding filtered columns, they can do so via the Listing -> Set Columns option.
In the popup window that appears, users will be able to add columns of their choosing without necessarily filtering them (Object A and Object B in image below). Similar to the filtering on the Experiments List view, a user must first select a “Group” from the dropdown in Object A, and then select a value in Object B. If they wish to reorder the columns, users can drag and drop the lines Object C is pointing to. Columns can be removed entirely by using Object D.

In Object A above, you will get a similar list to the “Group” option in the filter options.

At any time, if a user wishes to export the table out to an Excel spreadsheet or csv, they can select the “Export” option from the Listing dropdown located directly above the table. “Get Count” will present the count of Experiments (aka number of rows) in the table that meet the filtering criteria.

Should a user want to take some or all entries of the table and bring those Experiments to a Compare page, they can use the Checkbox options on the left side of the table and select individual Experiments or all filtered Experiments. Object A in the image below will select/deselect a single Experiment. Object B will select/deselect all Experiments in the table, and selecting the “Compare” option from the dropdown of Object C will bring those selections to a Compare Page.

Once a User has created a table and set of filter options they would like to re-use/re-create/share with others, that is easily enabled via the “Presets” option in the Listing dropdown.

Via Presets, users can use Object A in the image below to delete Available Presets. Object B will allow users to load available presets. When creating a new Preset, users can type the new name into Object 1, and choose to include (or not) the Filters and Columns in the current table they want to save for future use (Objects C & D).
