9/13/24
Improved Visual Differentiation for Test Samples on Enter Measurements
To enhance clarity, we’ve made changes to the row structure on the Enter Measurements page, improving the visual hierarchy for base experiments, test samples, child, and grandchild experiments. Key changes are listed below.
- Grey Background for Test Samples, Child, and Grandchild Data Tables
Data tables for test samples, child, and grandchild experiments now have a horizontal grey background to help distinguish sections more clearly. Base experiments have no background color. Gaps between test samples remain uncolored to maintain separation between different samples. - Extended Table Divider Lines
Divider lines within tables now extend all the way across the page, making it easier to visually separate outputs and organization tables. - Test Sample Coloring for Table Borders
A colored top border is applied to the first table of each test sample, while subsequent tables within the same sample will have a standard grey border. The colored border remains on the left edge of each table contained within the test sample.

These changes were implemented to create a more intuitive, easy-to-read layout for experiments involving multiple test samples, particularly for those working with coatings and panel testing.
New Table Parameter Promotion for Column Parameters
A new feature for sorting and organizing outputs on the Enter Measurement page allows users to simplify the organization of their output tables by promoting constant column parameters to table parameters.
Within the Organize tab of the “Sorting and Organization” modal, selecting the “Promote Constant Column Parameters” option turns any column parameter with a consistent value to a table parameter, removing unnecessary columns from the table.
For example, if all outputs have the same Aging Temperature (100°C), the column can be removed entirely, and the value will appear next to the output category name instead as a “promoted condition parameter”.
This update helps reduce table clutter and improve readability, especially when dealing with multiple condition parameters.


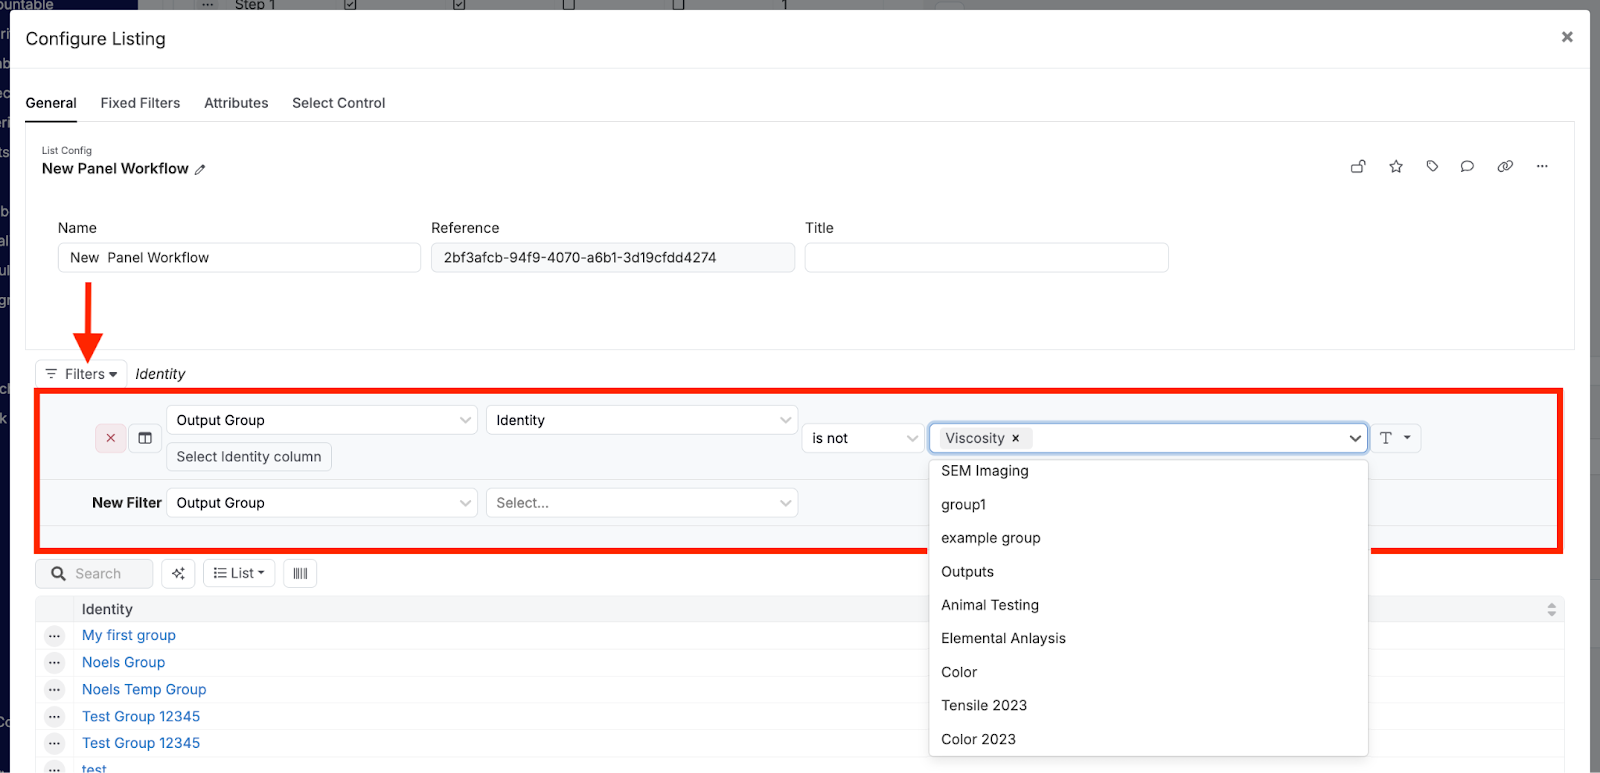
Linked Entity Filters in Notebooks
A new update to Notebooks allows users to use linked entities within structured listing filters.
To apply a filter based on a linked entity, set up a new filter using the “includes” command, then click the box next to the “Select” dropdown menu and choose “Use Linked Entity.” This will enable you to select an entity directly from the dropdown, making it easier to filter listings by linked entity data.


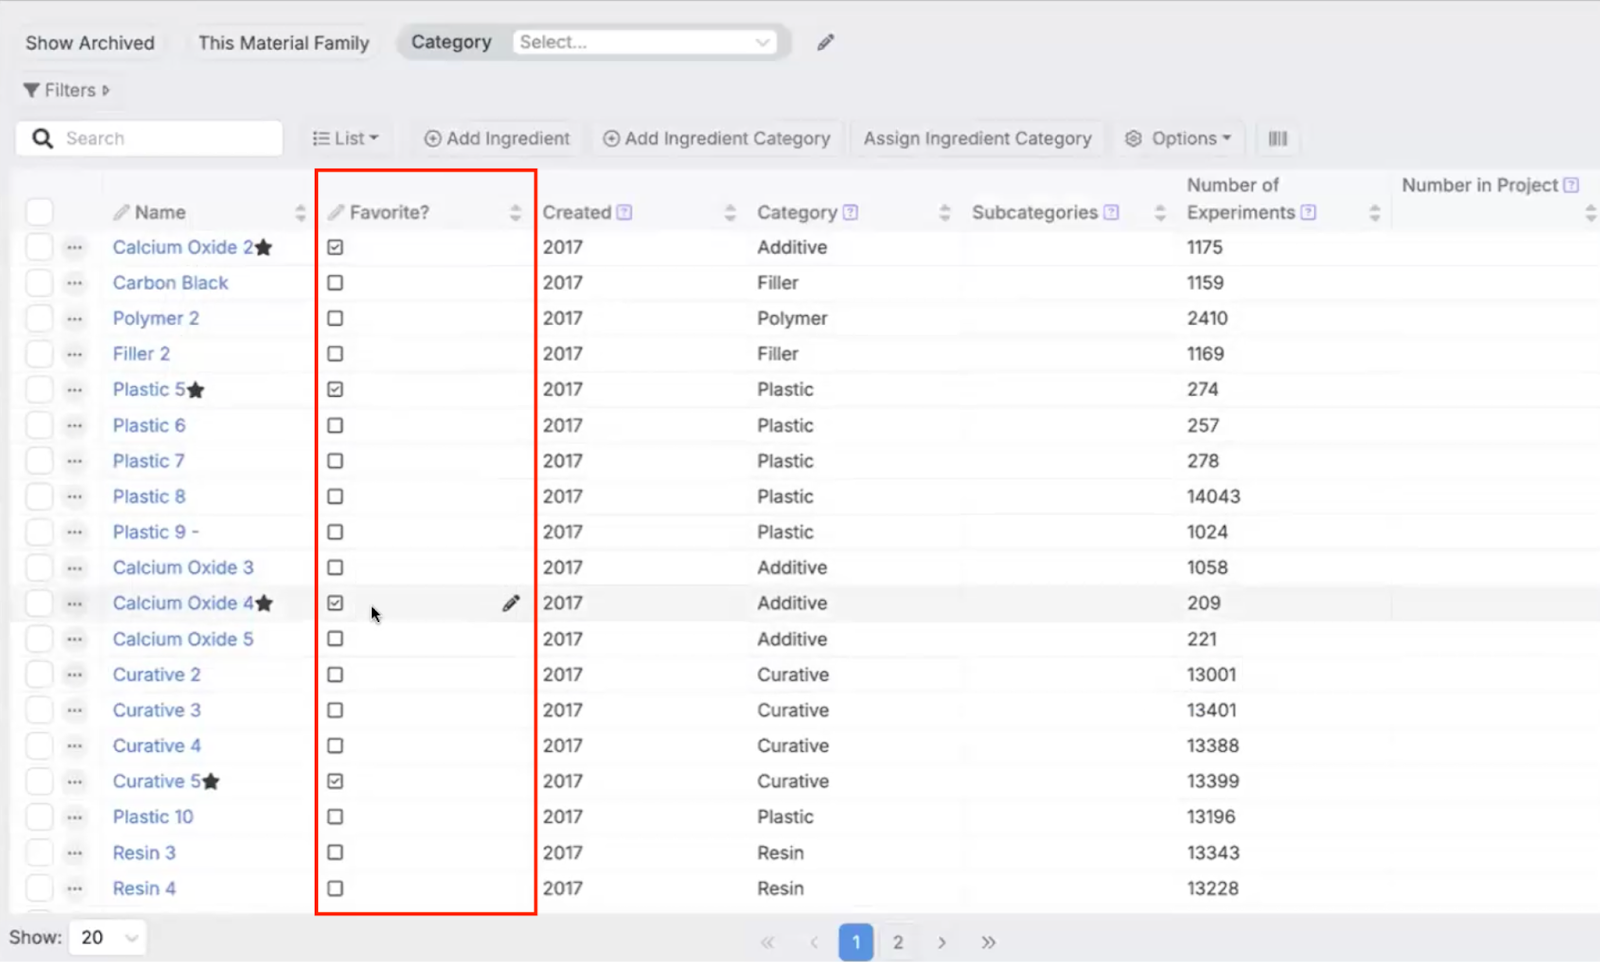
Set Columns as “Primary” in Listings
Columns in listings can now be designated as “primary,” which lightens the column background and bolds all entries for better visibility. Multiple columns can be marked as primary simultaneously.
To set a column as primary, click on the column header, select “Edit Format Override,” and choose “Primary” under the “Column Type” Display setting in the dropdown menu.


Set Default Quantities for Ingredients
Default quantities can now be added for ingredients on the Ingredient page under the “Default Quantity” field. For example, if an ingredient is given a default quantity of 10, it will automatically populate with that value when added to a recipe.
If the ingredient also belongs to a category with a “Default Selection Category” value, the individual ingredient’s default quantity will override the category default.


In the example below, an ingredient with a default quantity of 10 will display a value of 10 when added to a recipe. An ingredient belonging to a category with a default selection category value of 1 will display a value of 1 (Object 1). However, if an ingredient has both a default quantity of 10 and is part of a category with a default selection value of 1, it will still display its individual default quantity of 10 (Object 2).


Solver Side Panel Enhancements: Refresh Persistence and Feasibility Indicators
The Solver side panel has been improved with two significant updates:
- Refresh Persistence: The side panel now remains visible even after refreshing the page. This means you won’t have to re-open the panel after a refresh.
- Feasibility Indicators: Users will now see a new indication of recipe feasibility and constraints without needing to click “Solve.” Previously, users would only discover feasibility issues and constraint errors after solving Now, the side panel provides real-time feedback on the feasibility of your recipe and constraints, helping you identify and address potential issues before running the solve function.

Improved Support for Date and Time Calculations
Support for “Date Time” and “Date” calculations has been upgraded to enhance functionality. Users can now utilize the “Identity” calculation to directly reflect a date output within calculations. These calculations will also appear on the Compare page.
Future updates are also in progress to support additional functions for manipulating dates directly from the Enter Measurements page.


New “Shallow” Breakdown Option for Intermediates
A new “Shallow” breakdown option has been introduced for handling intermediates in the Uncountable platform. Previously, when breaking down intermediates using the “Compounded” breakdown option, all nested components were fully expanded, including any intermediate components.
With the introduction of the Shallow breakdown option, intermediates are expanded at just one level down, showing all direct components while leaving nested intermediates in their original form.
In the example below, intermediate BB contains plastics and intermediate AA. A shallow breakdown will list all plastics and show “intermediate AA” without expanding it further.


Create Experiment Groups from Templates from the Project Dashboard
Uncountable users now have the ability to create experiment groups directly from the dashboard, improving accessibility and streamlining workflow. Previously, creating experiment groups from a template required being in the Well Plate Editor.
To do so, click the menu arrow next to “+ New Experiments” and select “New Experiment Group from Template”. Then, select your template from the dropdown menu before clicking “Create”.

New Action for Recently Viewed Entities
A new tool has been added to the Entities Viewed page, which allows you to select multiple Entities Viewed from the listing and display them all on the Enter Recipe page.
To use this feature, select multiple entities from the page’s listing, click the selection button, and select the “View All Recipes” action. This will open all associated recipes, allowing you to efficiently access and manage your recent entries.


New Feature for Recipe Entity Fields: Enhanced Copy Behavior
A new feature has been introduced to enhance the management of recipe entity fields with improved copy behavior. This functionality allows you to control how certain fields are copied within definitions.
When viewing the default fields of a definition from the Form Admin, you’ll find the “Fundamental Constraints” section in the constraint settings. Here, you can configure the behavior for copying fields. There are two primary options available: “Auto” and “Not Copy.”
- Auto: This default option automatically supports the copying of field.
- Not Copy: Selecting this option prevents the automatic copying of fields.
This feature ensures that critical behaviors are safeguarded during the copying process, preventing potential data corruption and enhancing consistency across your recipes.

Improved Differentiating of Test Samples and Outputs on Lab Request
The UI of a lab request has been updated to improve the distinction between test samples, child test samples, and their outputs within lab requests.
Test samples and their child samples are now highlighted with distinct colors and feature bump-out lines. This visual enhancement helps easily identify nested test samples and their associated outputs, making it clearer and more intuitive to manage complex lab requests.

Enhanced Notification Options for Shared Entities
Sending notifications when entities are shared has been recently improved. You can now opt to send notifications when sharing recipes by selecting the option to notify subscribed users.
Notifications will be sent to the relevant users via both in-platform notifications and email. You also have the option to write an additional message.
Currently, this feature is available for recipes, with plans to extend it to other entity types in the future.


UI Consistency Enhancements for Ingredient Sections
Recent updates have enhanced the user experience by aligning the Expanded Ingredient section with the Standard Ingredient section on the Enter Recipe page.
The Expanded Ingredient section now better reflects the standard ingredient section. You can select and edit ingredients, adjust values such as solid percentages, and save changes. Units have also been added, and all data is integrated into the data grid. This will support the future addition of more columns.

Support for Notes on Experiment Groups
Uncountable users can now add notes to experiment groups directly from both the project dashboard and Enter pages.
From the project dashboard, open the experiment group’s dropdown menu and select “Edit Experiment Group Notes.” Enter your notes in the provided modal and click “Save.” These notes will then appear next to the experiment group name on the dashboard.


On the Enter pages, simply click the experiment group’s dropdown menu at the top of the page and choose “Edit Experiment Group Notes” to add or update notes.

New Modal for Table Building on Enter Pages
A new modal has been introduced on the Enter pages to make it easier to process create and add adding tables to notebooks.
To use this feature, select “Build Table” from the file menu. From the modal, users can choose to create a table in the Table Builder, add it to a new or existing notebook, or create a new notebook directly from the side panel on the Enter page. The two buttons at the bottom of the modal allow you to “Create in Side Panel” or “Navigate to the Notebook” upon creation.


Improved Per-Recipe Column Resizing
The resizing functionality for per-recipe columns has been enhanced. Users can now resize any per-recipe column individually, rather than just the first and last columns.
Resizing a per-recipe column will adjust all instances of that column type across the displayed experiments. In the screenshots below, resizing the lots column of one experiment adjusts the lots column of other experiments accordingly.

Additionally, if you hold the shift key while resizing, it now will resize all per-recipe columns simultaneously, without affecting the header columns (used for attributes or lots). In the screenshot below, note how resizing the lots column while holding down shift resized all other per-recipe columns as well.

Introducing Transitive Aggregate Columns
The new Transitive Aggregate Columns feature enhances the transitive column functionality by allowing you to dig deeper into fields that contain lists of values.
This feature is available within the “Select Columns” modal when a field with multiple values is selected. Select a target field, similar to transitive columns, and apply operations to customize how these values are collected and displayed.
There are three types of aggregates:
- Collect: For each field, display all values
- Distinct: For each field, display each unique value
- Count: A summation of values within that field
For example, using a “Collect” aggregate column, users can now gather and display all emails of the watchers on a lab request within a listing column.


Alternatively, using a “Distinct” aggregate column, you can filter, gather, and display all GHS symbols in experiments containing explosives.


Updates to Set Constraint Page
We’ve recently introduced several improvements to the Set Constraint page for better user experience and functionality.
The first notable change is the relocation of the experiment workflow type on the Set Constraint page. It now appears directly under the constraint name instead of being hidden in the cog dropdown menu, streamlining workflow changes and reducing clicks.

A second change on the Set Constraint page improves “Advanced Constraints” functionality. When selecting Product or Ratio constraint types, users can now manually specify minimum and maximum values. This change helps users better understand and control constraint behavior.

8/30/24
Rearrange Listing Columns
Uncountable users now have the ability to rearrange listing columns by clicking and dragging their headers. Changes are applied immediately, allowing for a customized and streamlined view of your data.
This enhancement provides greater flexibility in organizing your data by enabling you to reposition columns according to your preferences.
New Output Calculation Entity: Matched Criteria for Advanced Filtering
We have introduced a new output calculation entity that allows users to filter data using the “Matched Criteria” setting. This option allows users to filter data based on process parameters and/or recipe metadata from test samples.
To use Matched Criteria in an output calculation:
- Go to the output’s settings page, select “Edit Calculation,” and click “+ Add Entity” to access the Change Output Calculation Component modal.
- Define your output and specify the source from which to pull values, excluding “Experiments Outputs.”
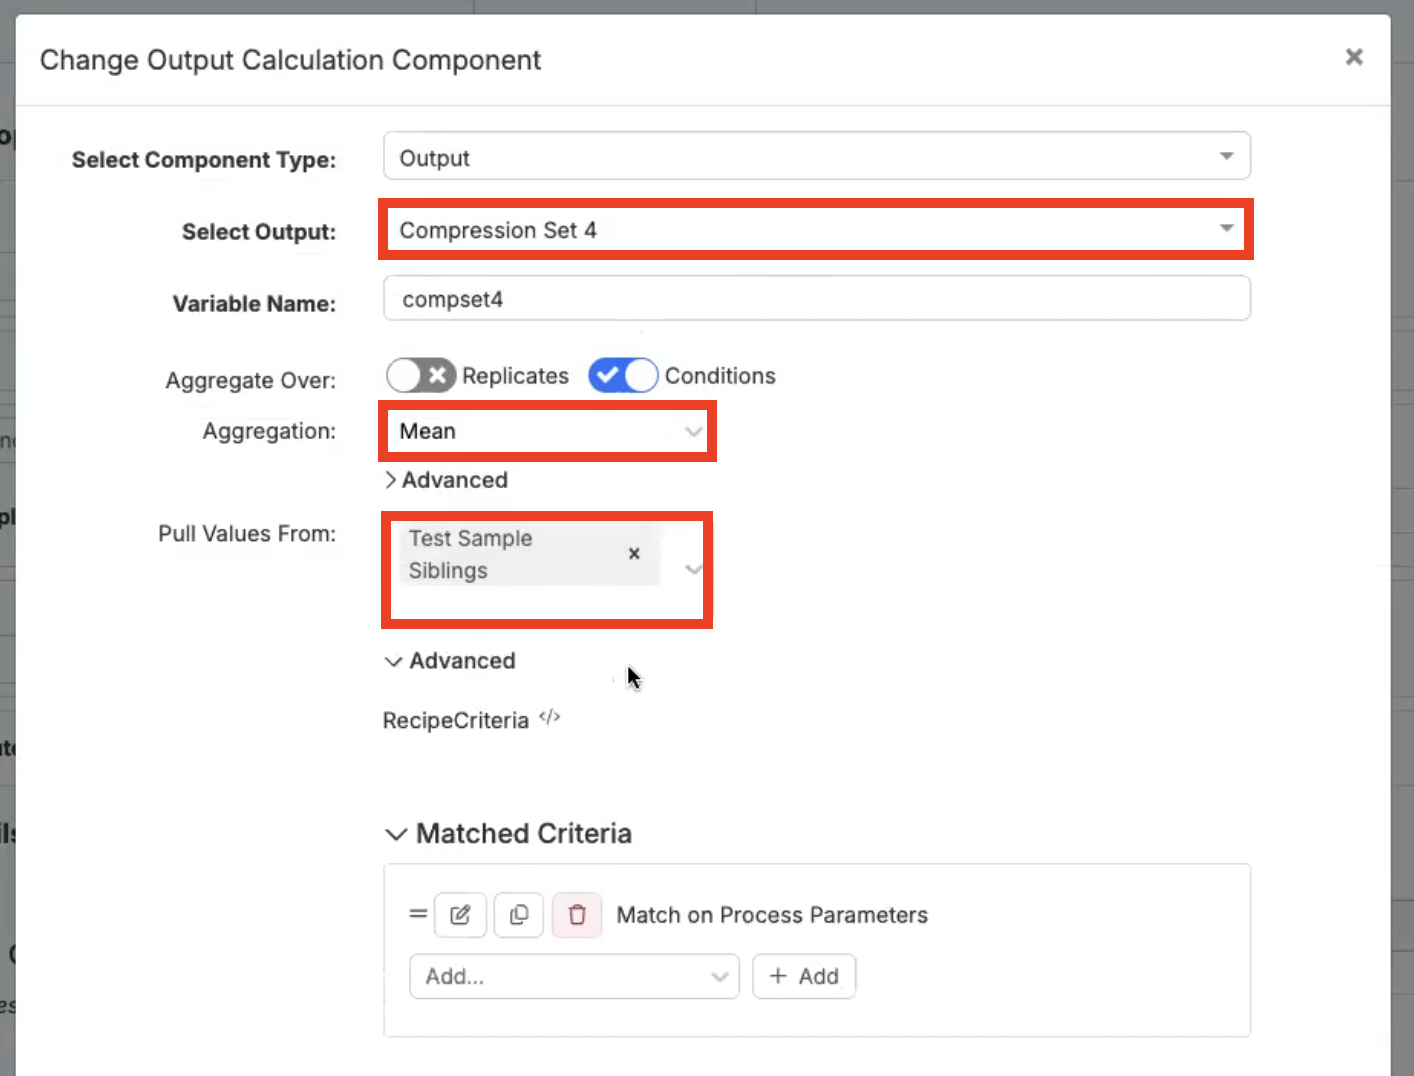
3. Under “Advanced”, select whether to match data based on process parameters or recipe metadata.
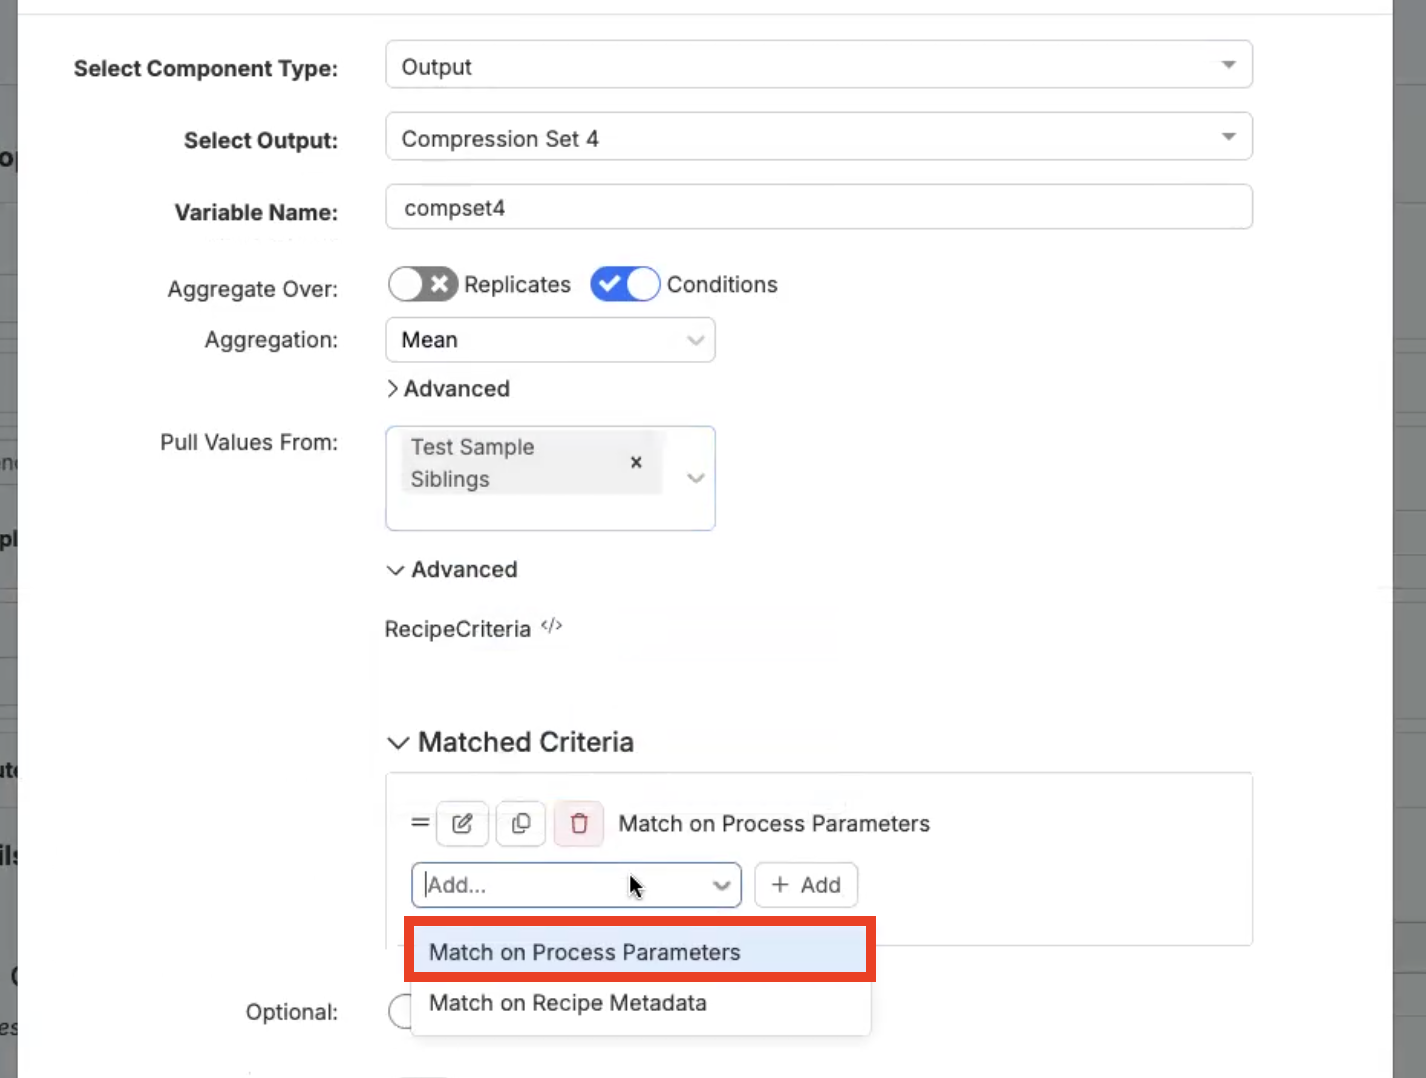
4. Click the “Edit” icon and configure which specific process parameters or metadata to match on.
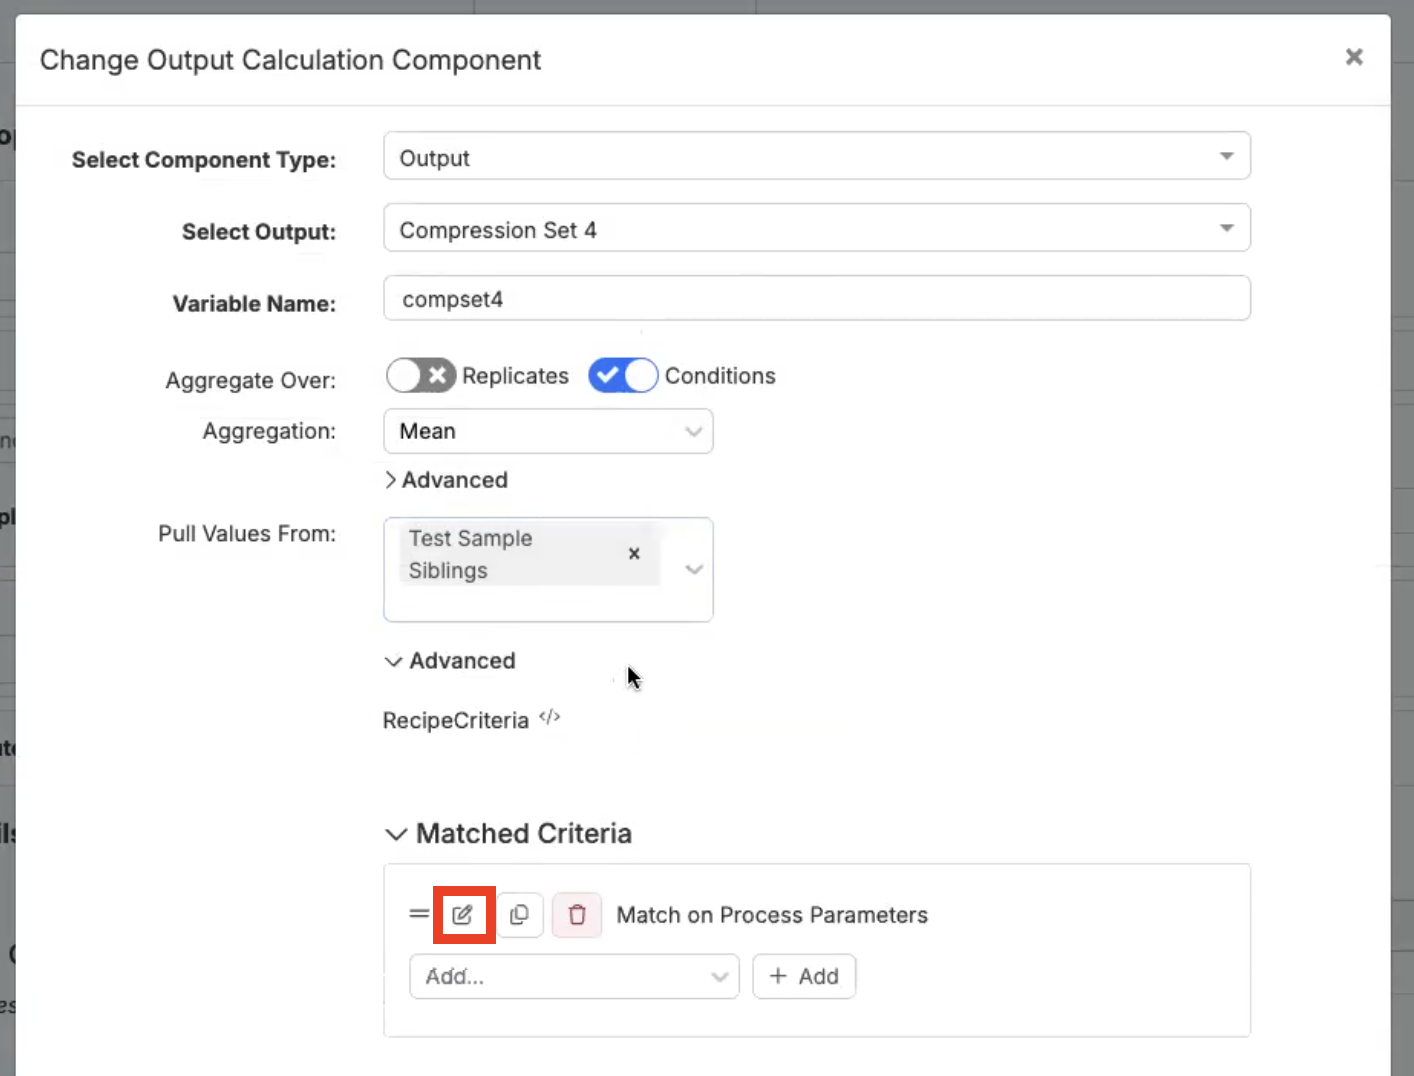
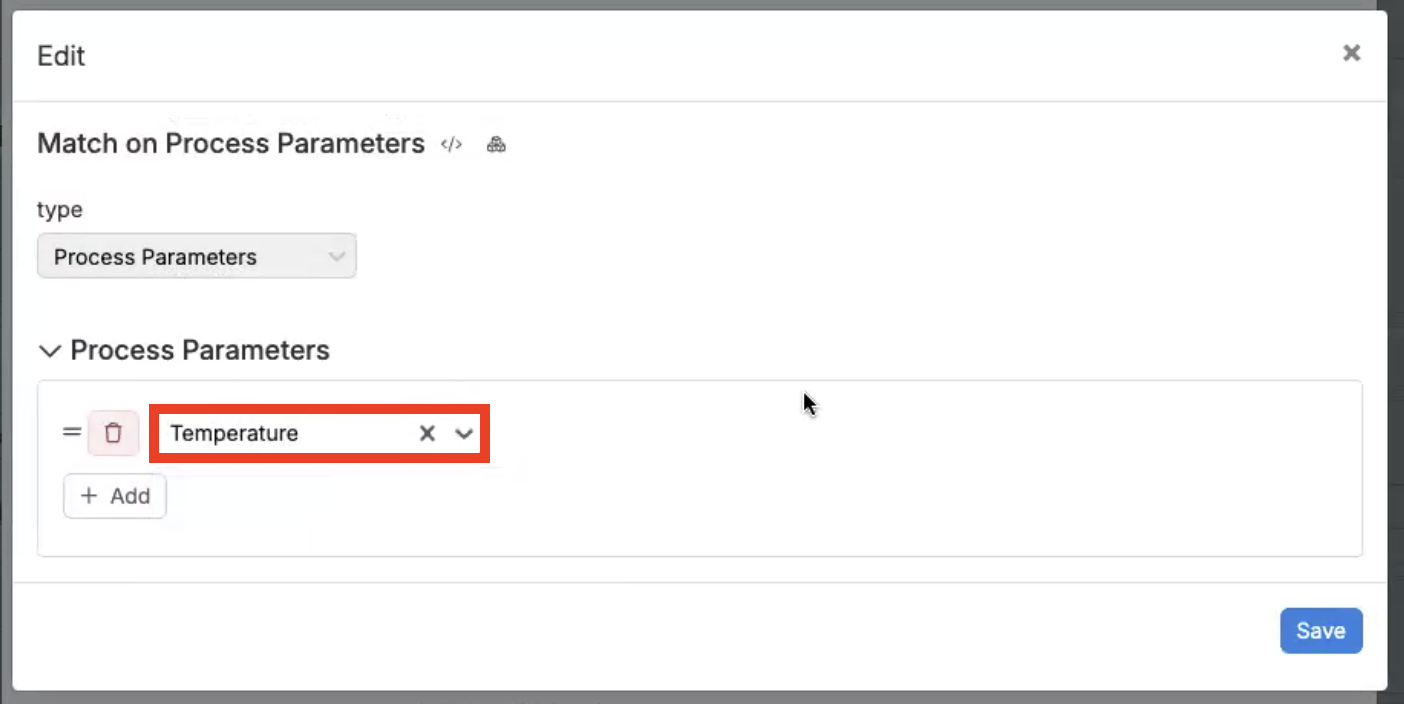
Once configured, on the Enter Measurements page, the output will be calculated based on Matched Criteria. For example, if you filter data to match test sample siblings based on the temperature process parameter, only siblings with the same temperature will be included in the output calculation.
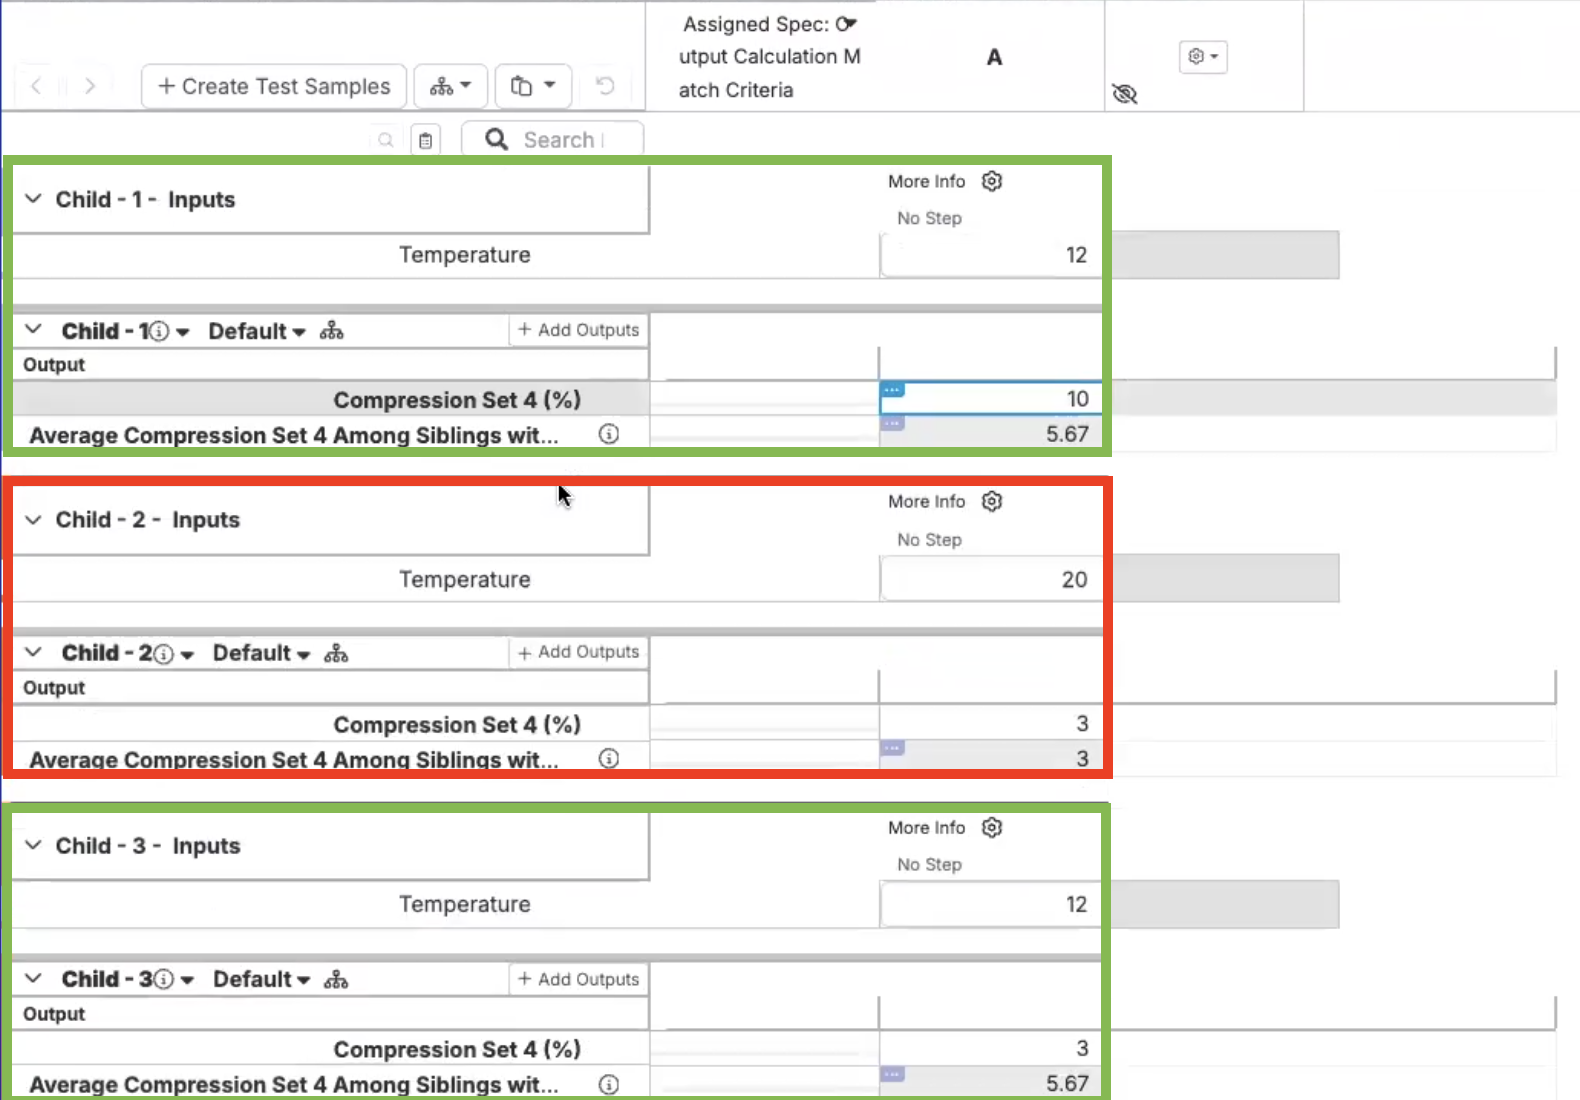
Note: Editing a process parameters or metadata will not automatically update the calculation, users must refresh to see the change.
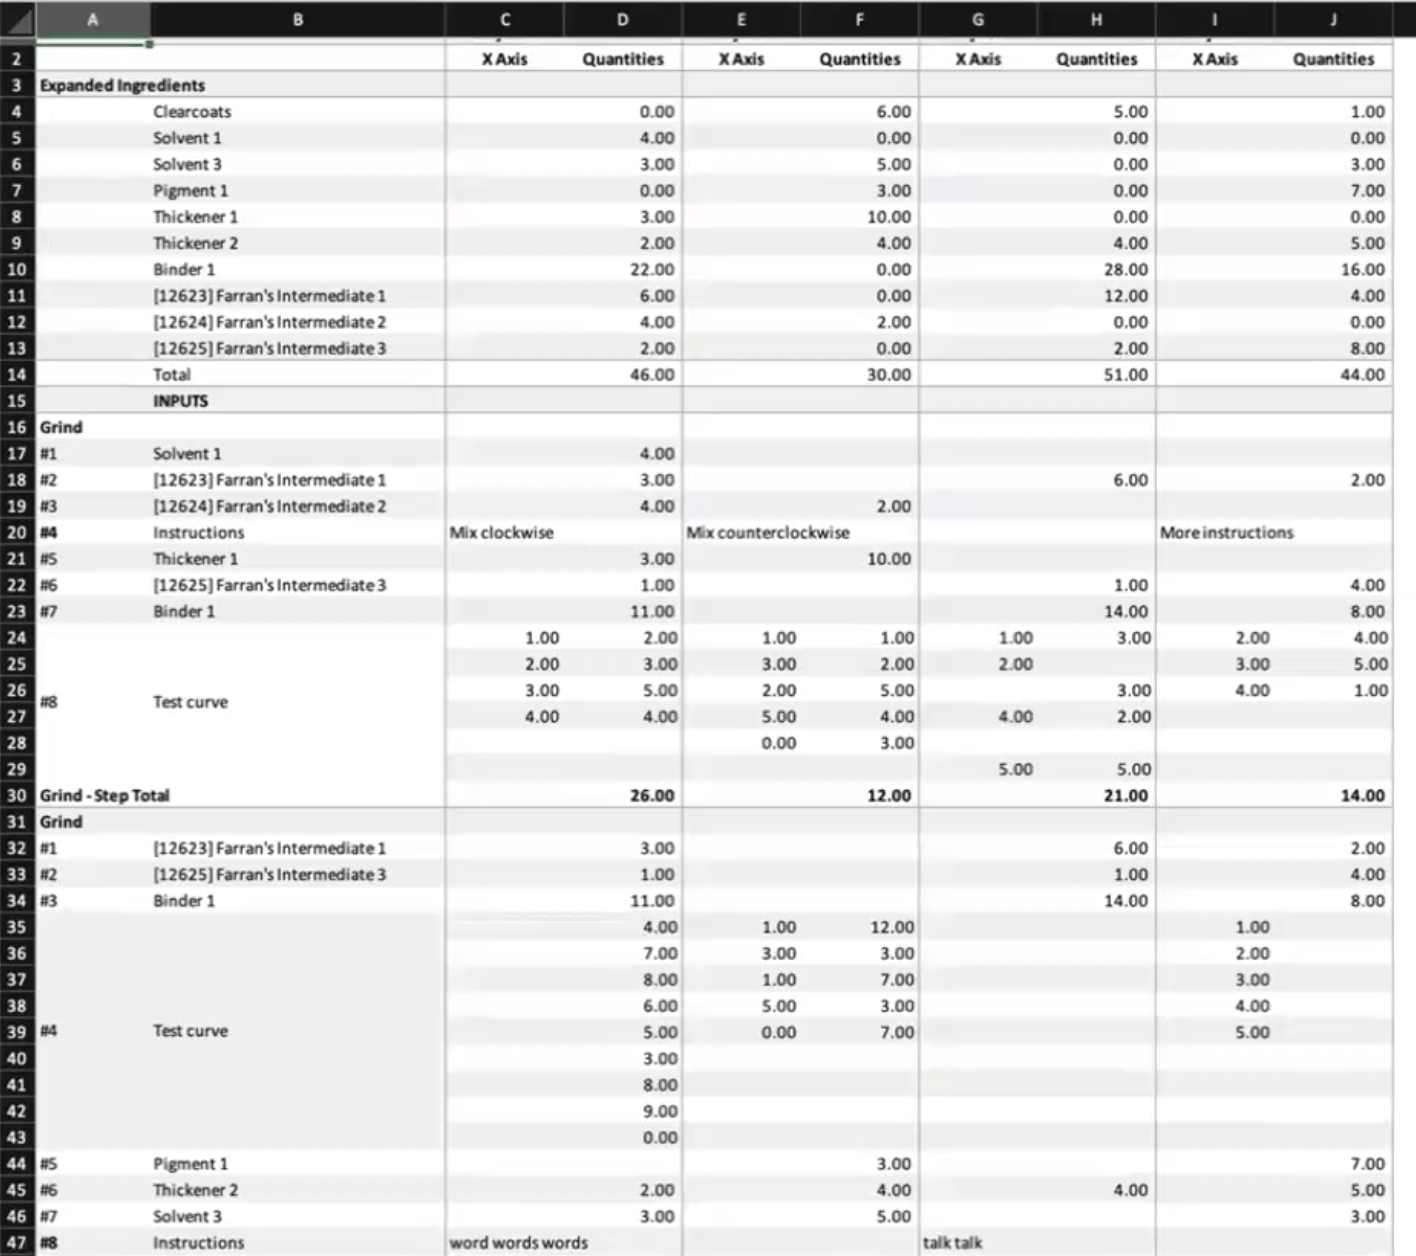
Intermediates Visibility in Runsheet Exports
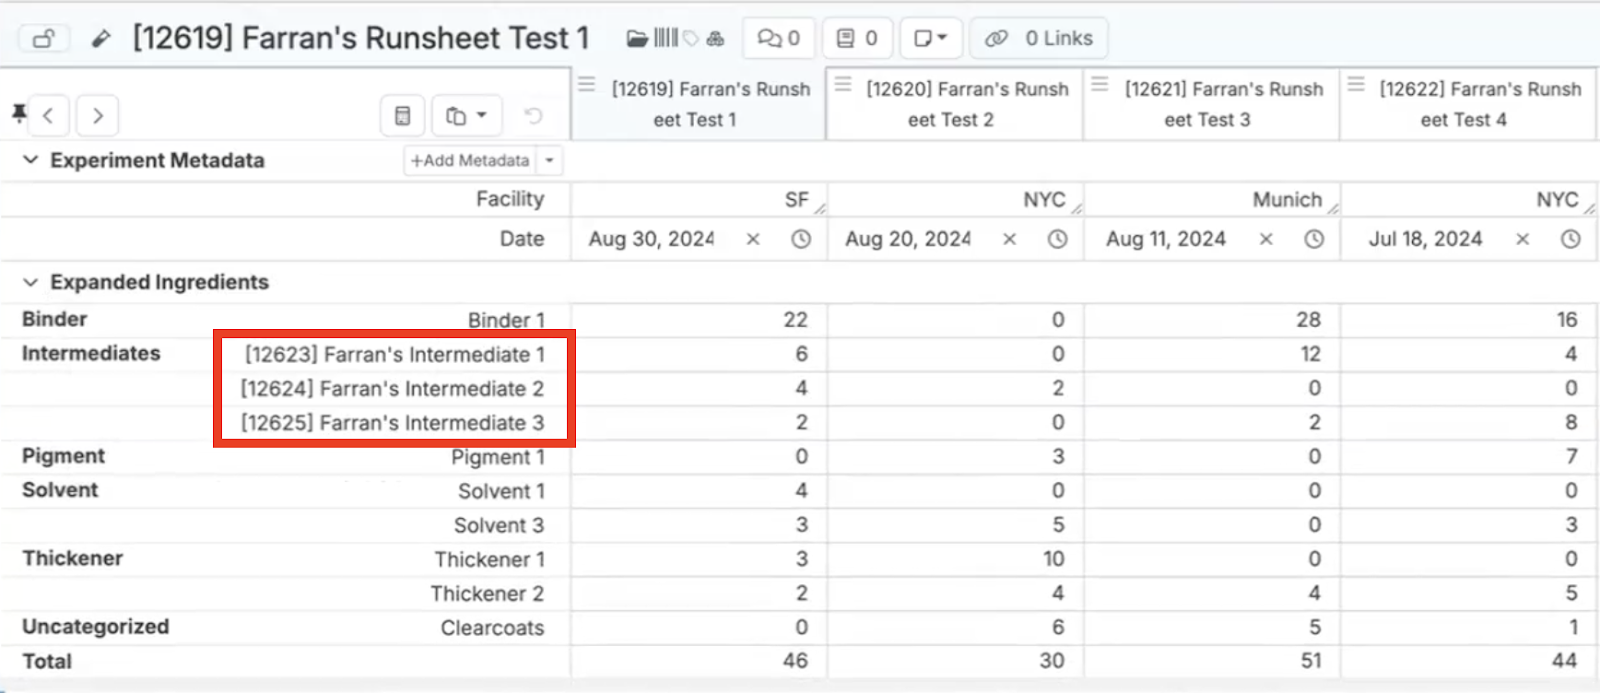
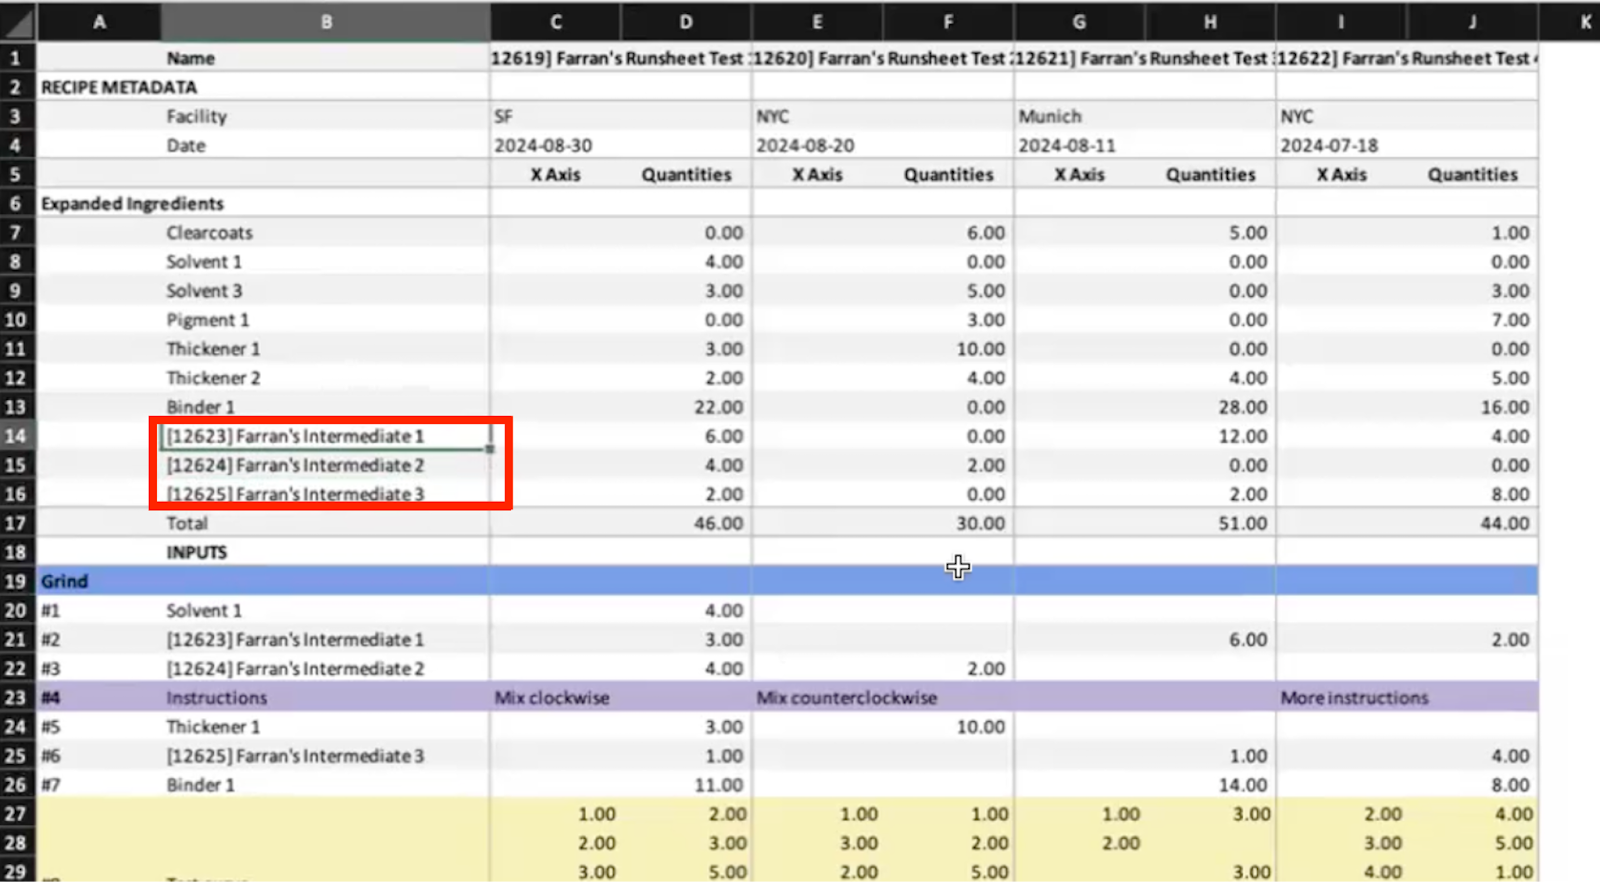
Runsheet exports have been updated to provide more detailed information.
Previously, exported runsheets in the expanded ingredients section only displayed compounded ingredients. Now, when you export without compounding, all intermediates will be shown, giving you a clearer and more comprehensive view of your recipe’s structure.
Curve Type Parameters in Runsheet Exports
Curve type process parameters are now fully supported in runsheet exports.
Before this update, these parameters were not included in the exported runsheet. Now all curve data will be visible, ensuring that your runsheets contain complete and accurate information.


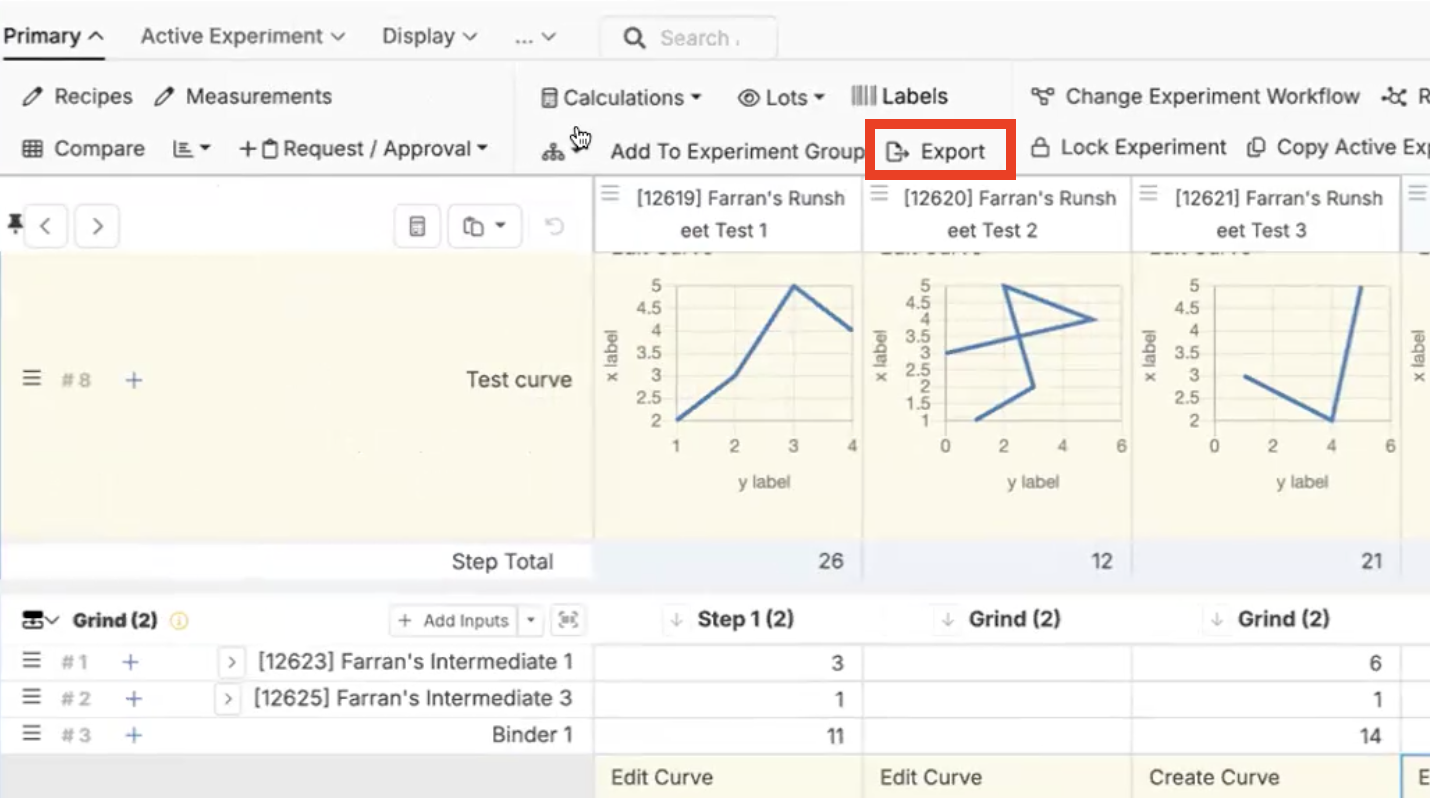
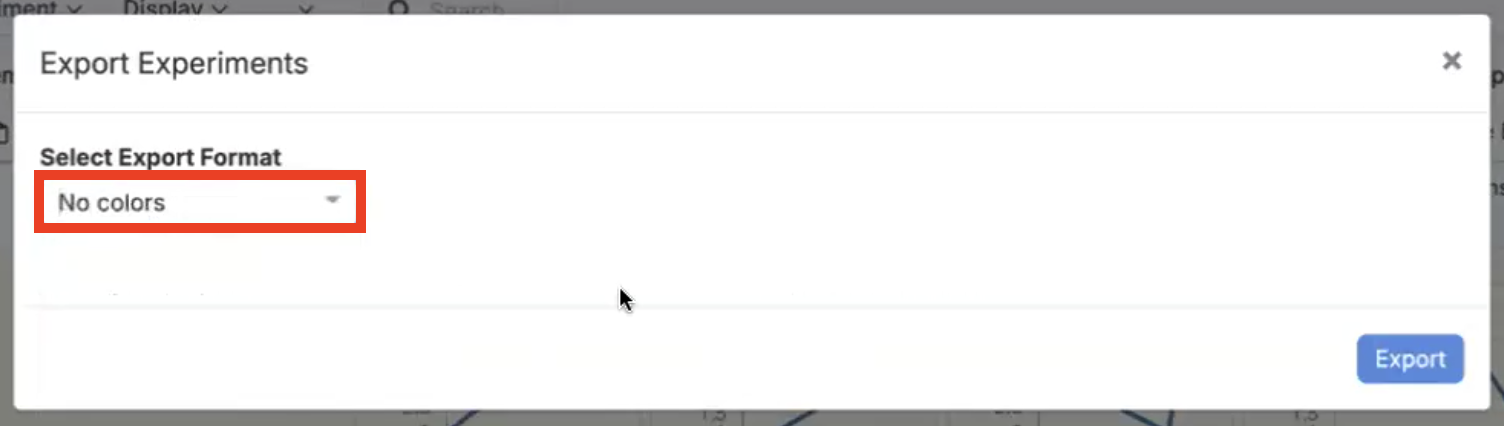
Printer-Friendly Black and White Runsheet Exports
A new option for exporting runsheets enables printing in black and white. By default, runsheets often include colored cells, which can be challenging for those using black and white printers.
Admins can now configure runsheets to be exported without color by clicking “Export” and setting the Export Format to “No Color.”
This update makes it easier to print runsheets in a format that suits each user’s printer type or preference.
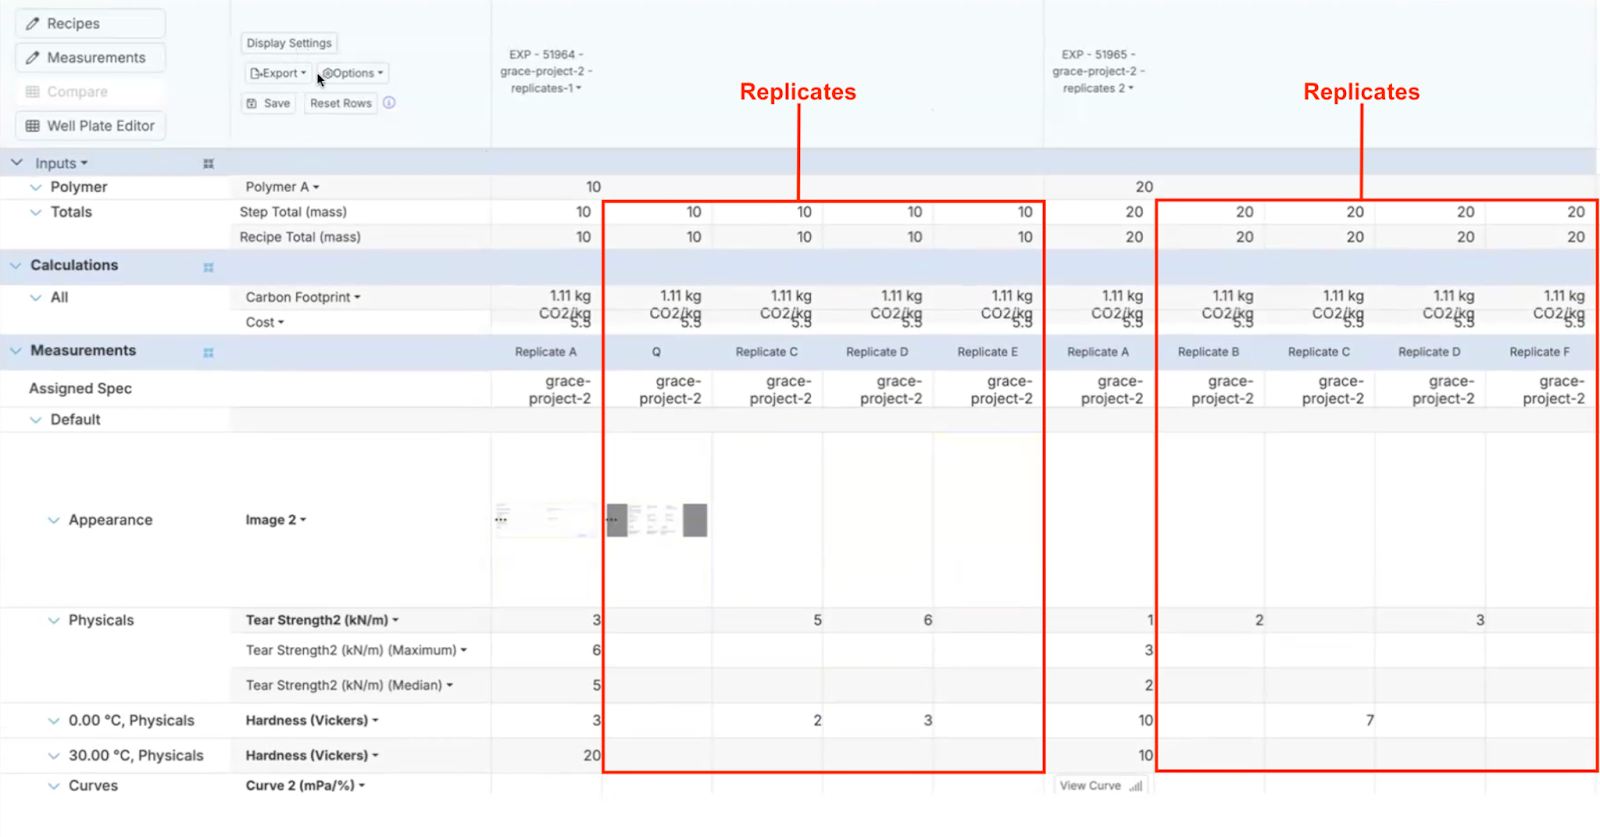
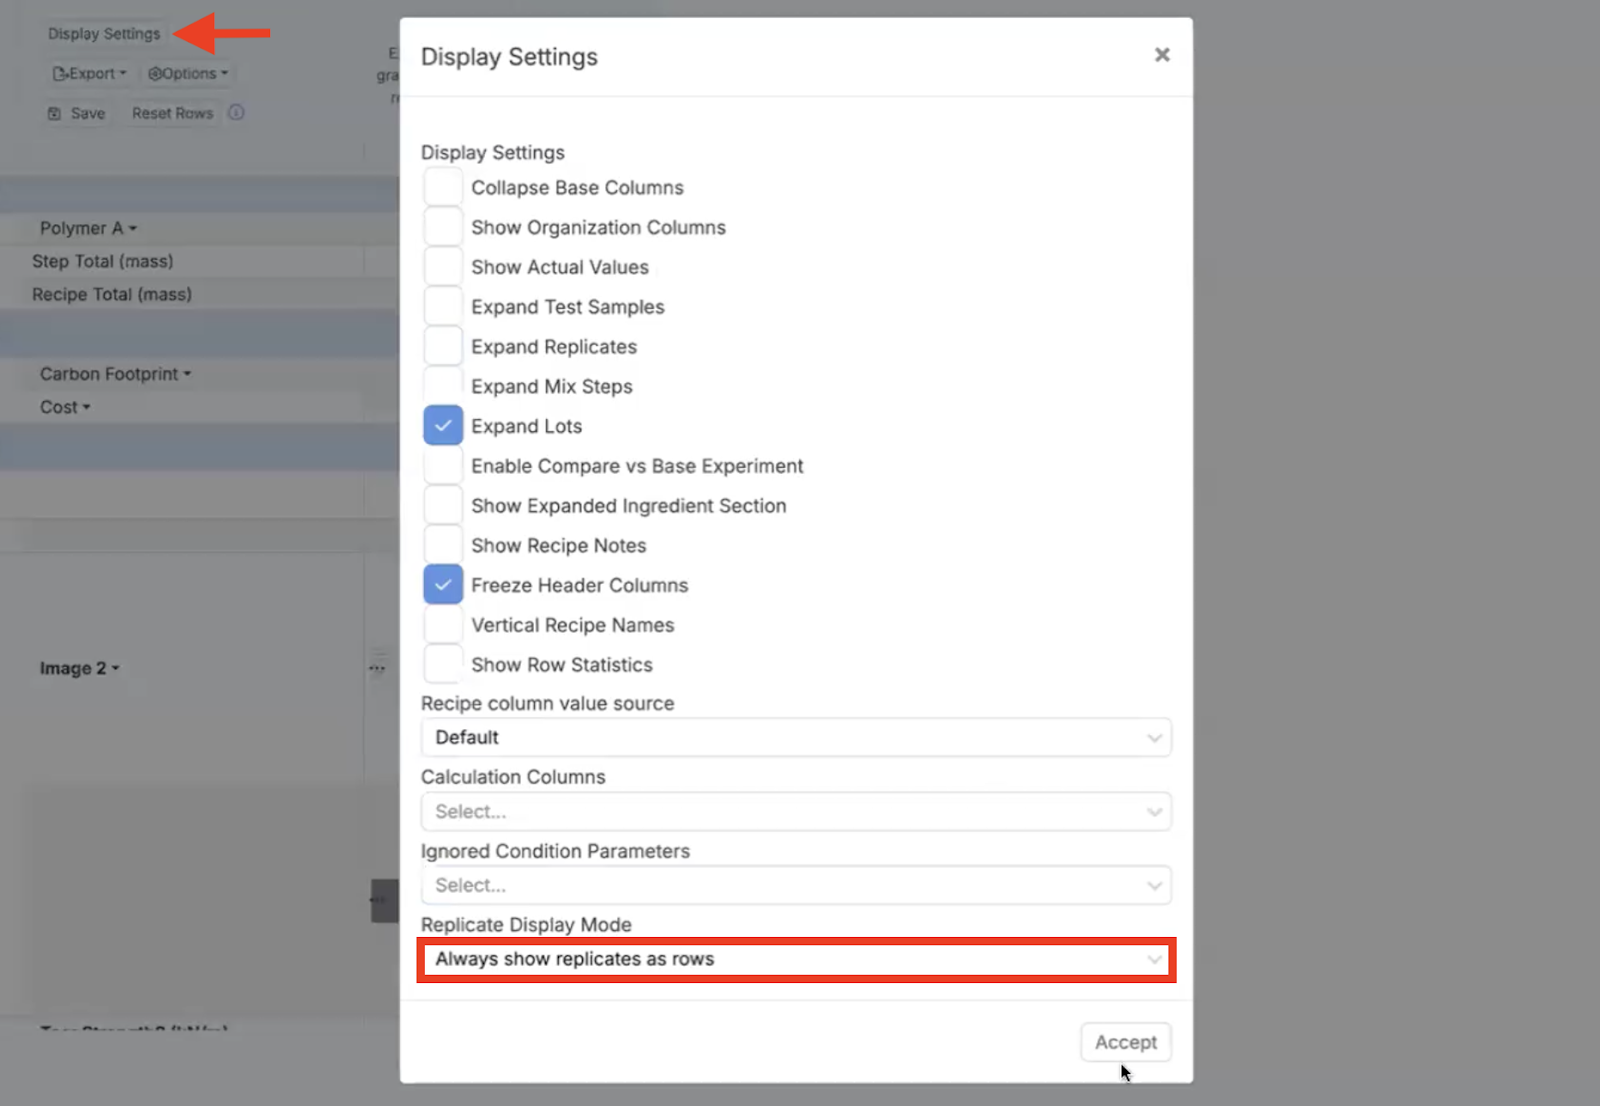
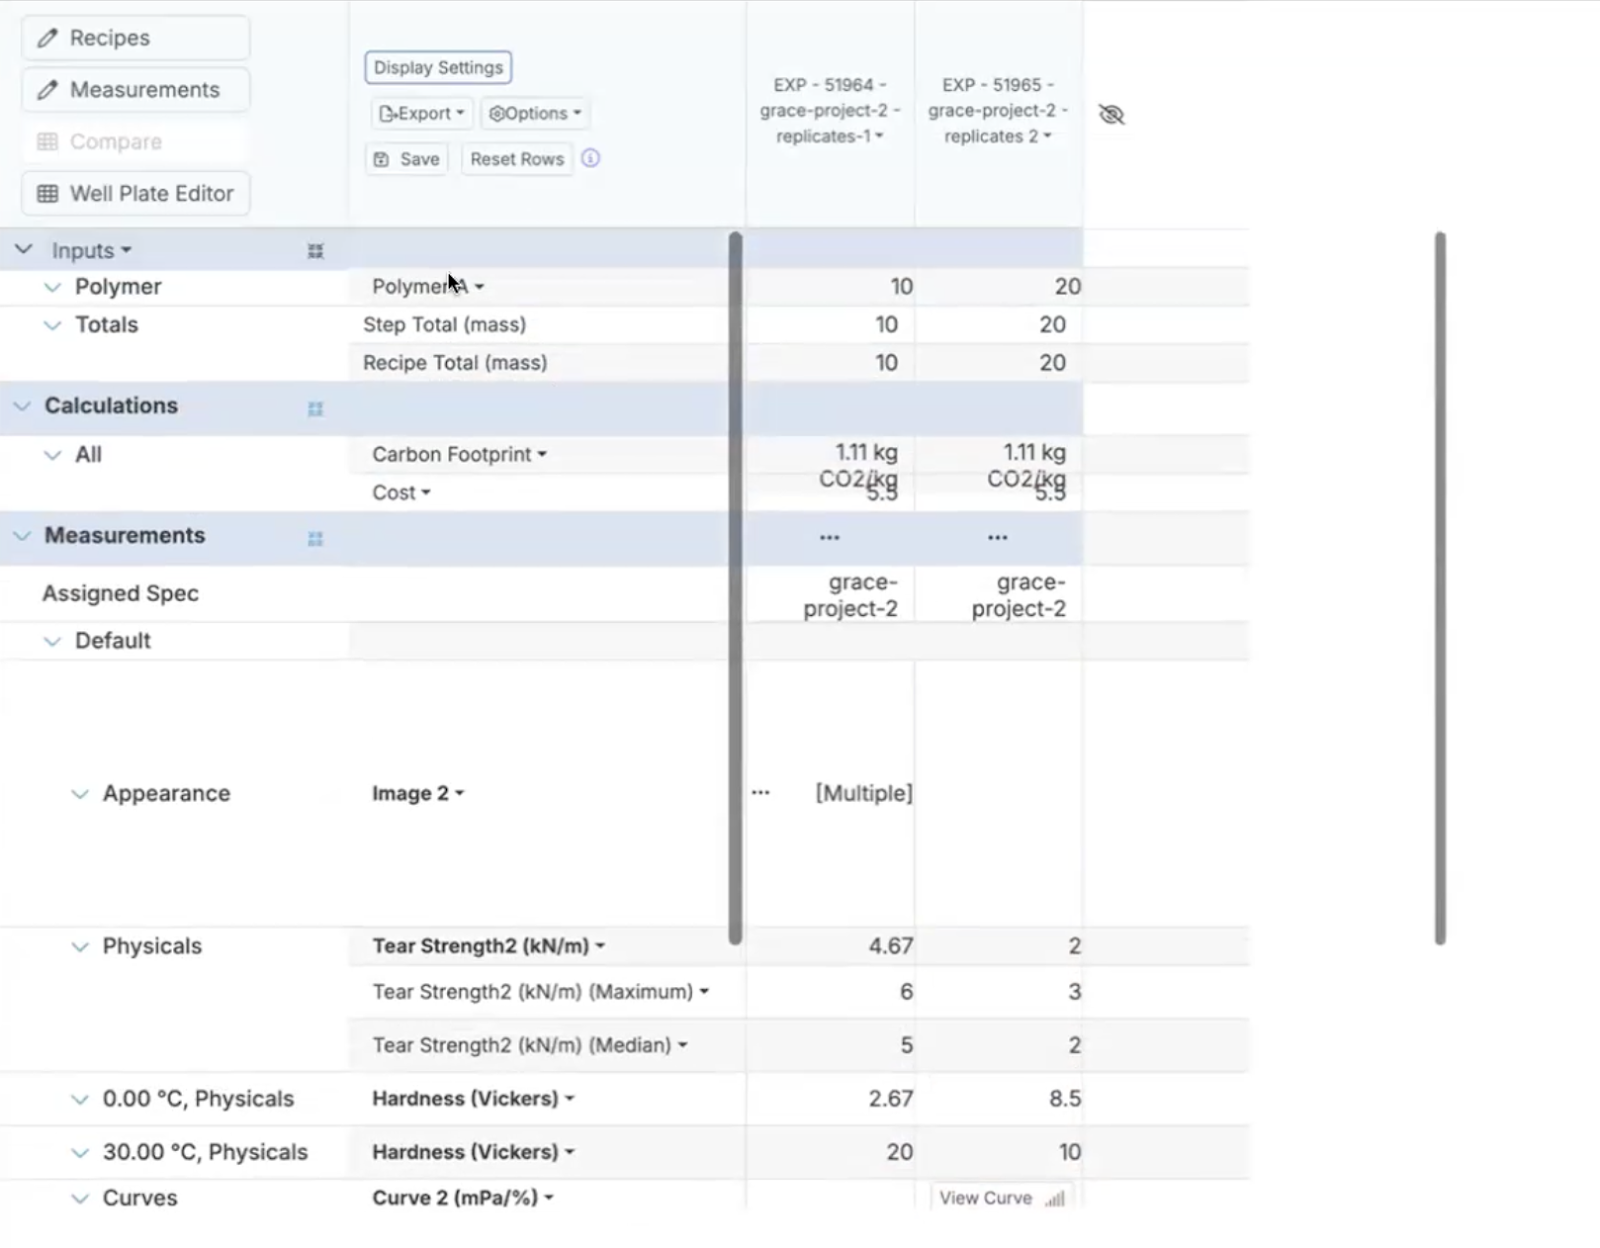
New Replicate Display Settings on Compare Page
A recent update to the Compare page was introduced to improve how replicates are displayed. Previously, replicates appeared as columns. Now, in Display Settings, replicates can be set to display as rows.
When Replicate Display Mode set to “Default”, when multiple replicates are present they will be displayed in rows. If there is a single replicate, it will continue to appear as a column.
This change mirrors the UI of the Enter Measurements page and provides a more consistent and flexible viewing experience.
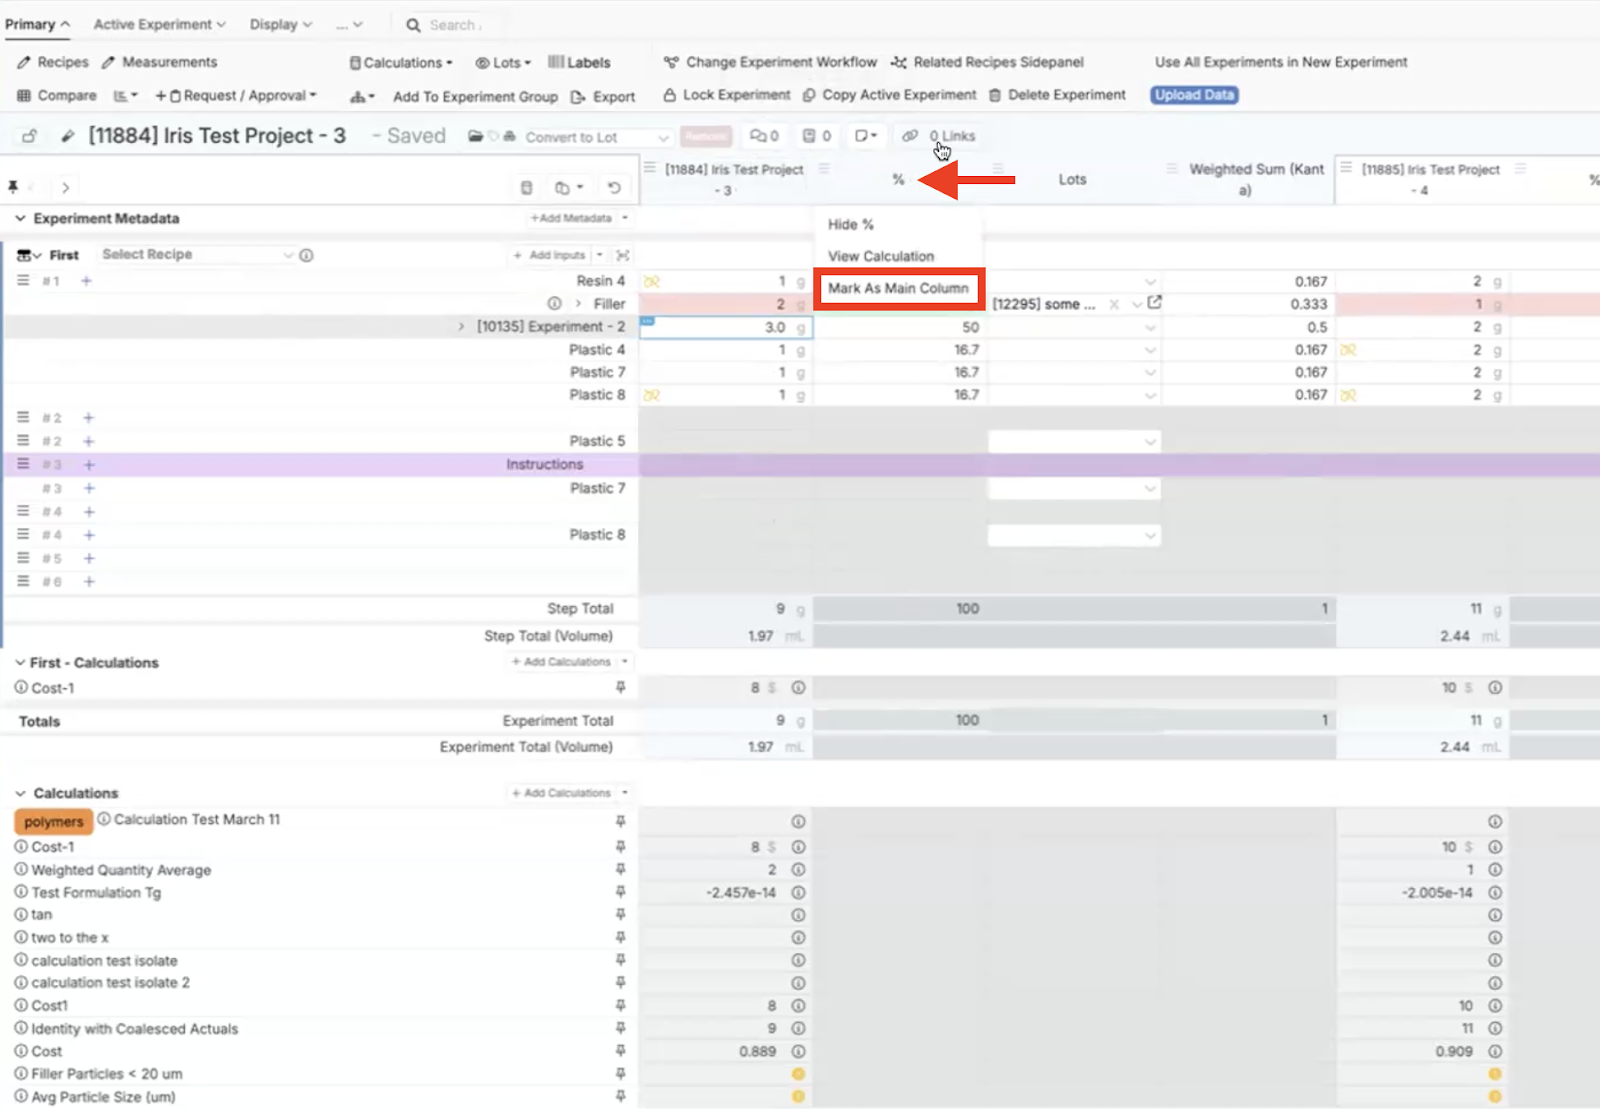
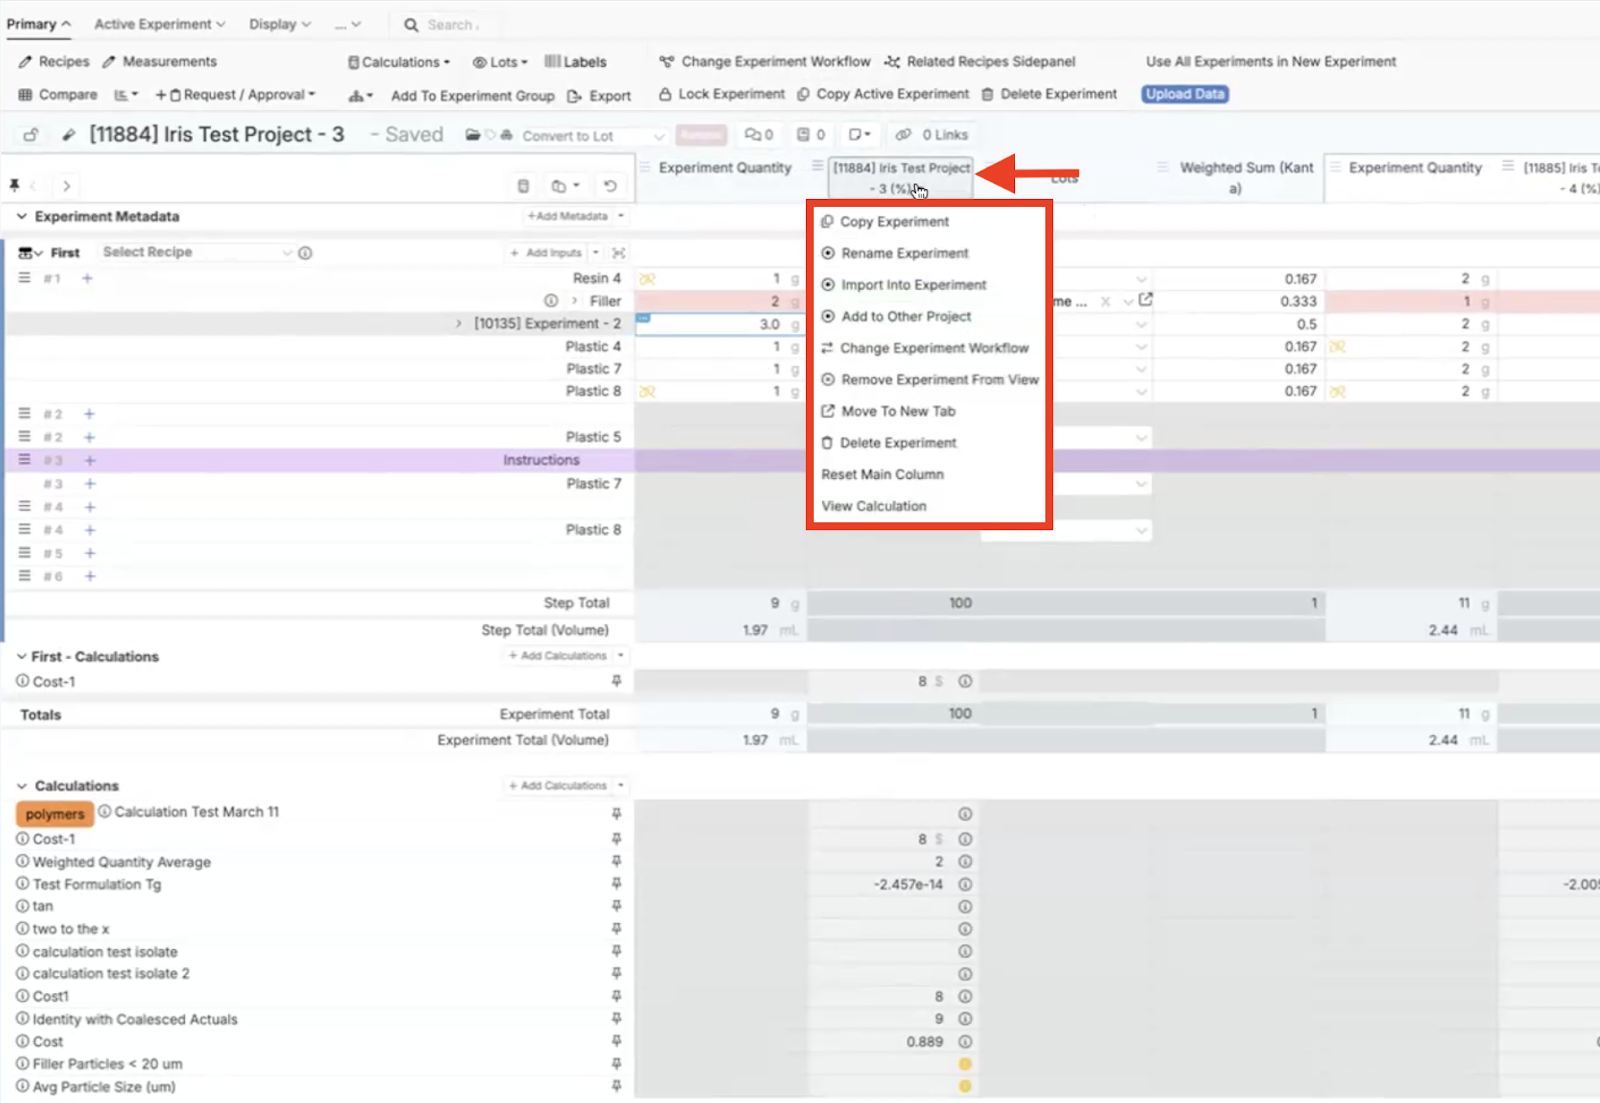
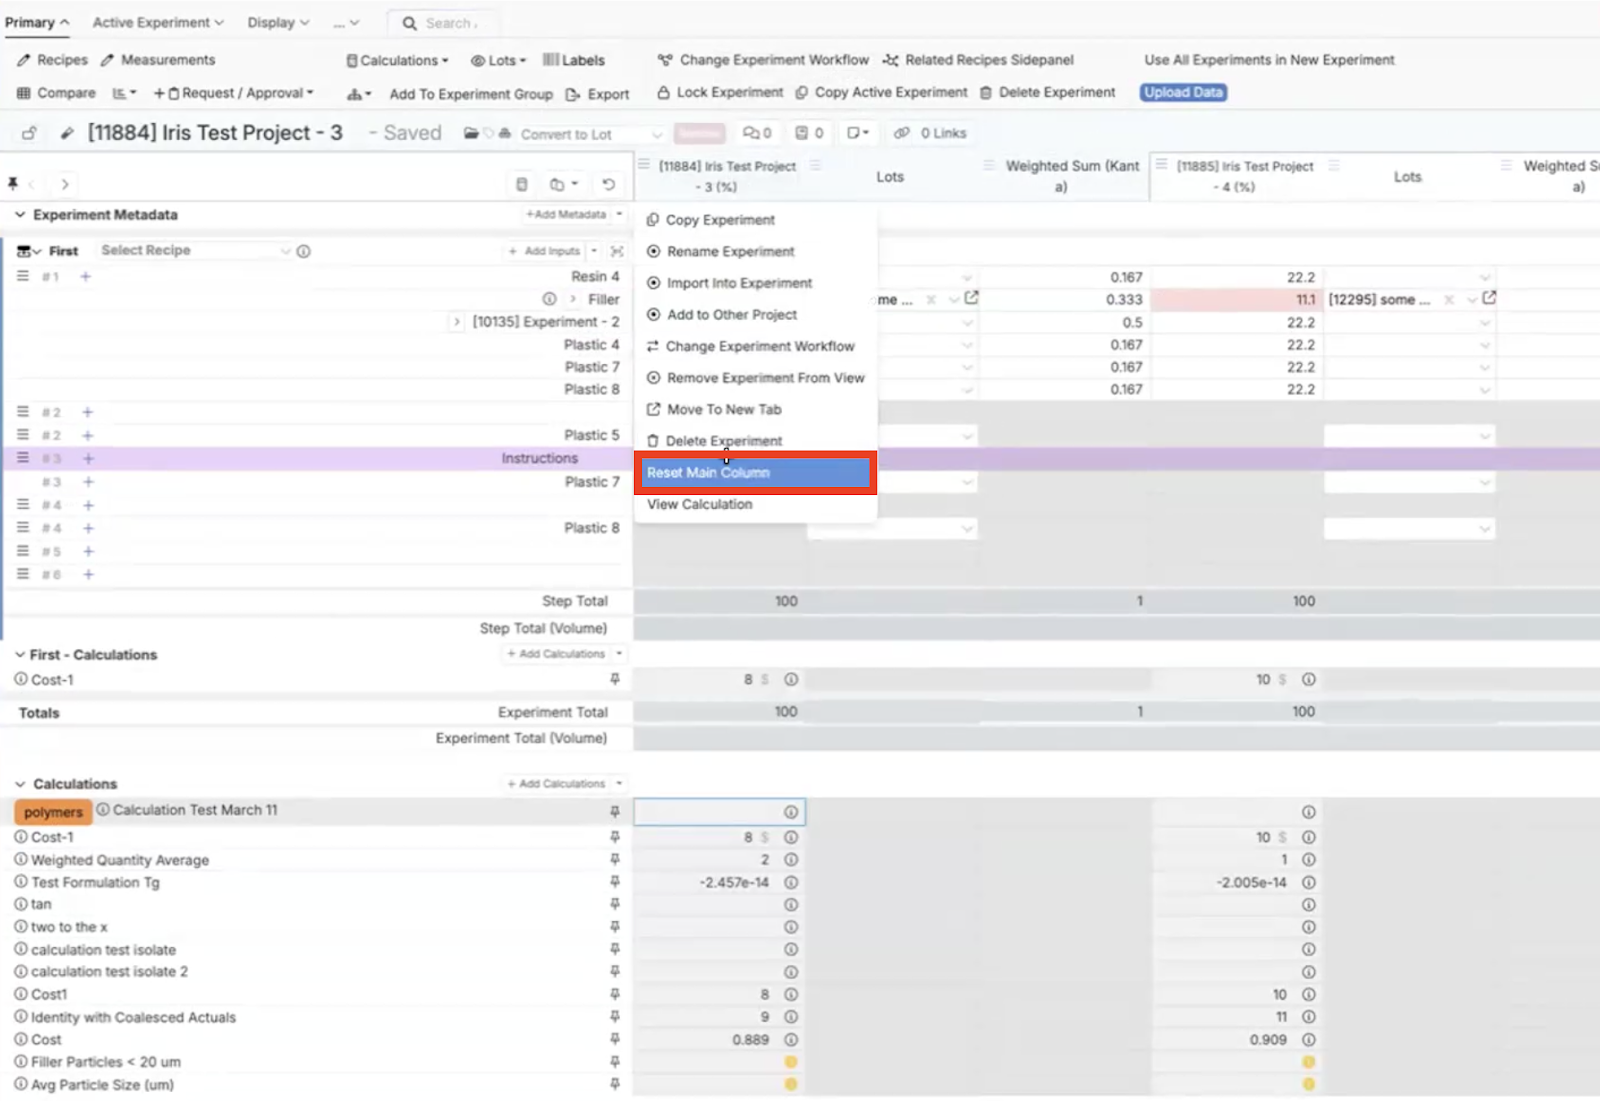
Main Column Selection on the Enter Recipe Page
On the Enter Recipe page, Uncountable users can now customize their “main column,” allowing them to set any column calculation as the primary column instead of the default recipe column. This update provides users with greater control over how data is displayed, and convert recipe units more broadly
To set a column calculation as the main column, click the column name and selecting “Mark as Main Column.” The main column will handle all key actions like copy, rename, import, and delete, while the original recipe column shifts to an experiment quantity column that can be hidden.
You can also click and drag the main column to reposition it. To reset the columns to their default state, choose “Reset” from the dropdown menu.
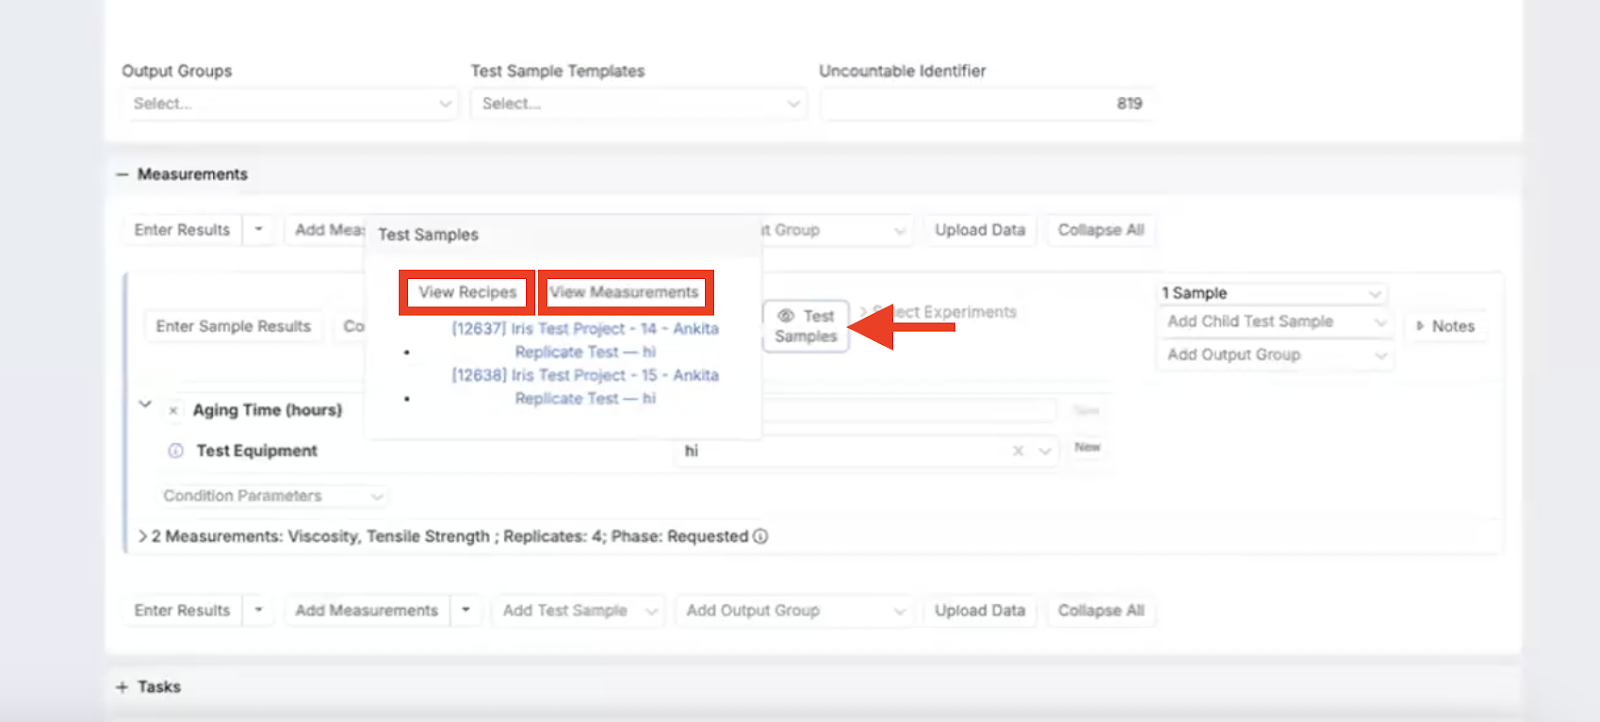
Test Samples Buttons Added to Lab Request Page
Two new buttons have been added to the Lab Request page for easier navigation.
If a lab request includes test samples, clicking the “Test Samples” button under the Measurements section will reveal two additional options: “View Recipes” and “View Measurements.” These buttons provide quick access, taking you directly to the Recipe and Measurement pages for the test samples.
Limiting Workflow Outputs and Output Groups
You can now limit which outputs or output groups can be added to certain experiment types via workflows restrictions in Uncountable. This is especially useful for scenarios like multi-layer panel testing, where liquid tests (i.e., pH, viscosity) need to be performed on the parent recipe. With this update, you can configure workflows to prevent certain outputs or groups from being added to the test samples (and vice versa), ensuring data is stored correctly and users see more relevant fields.
To do so, head to the Edit Workflow page, select your workflow, and configure restrictions using the Output Select Override and Output Groups Select Override options. For more details, check out the Limit Workflow article.


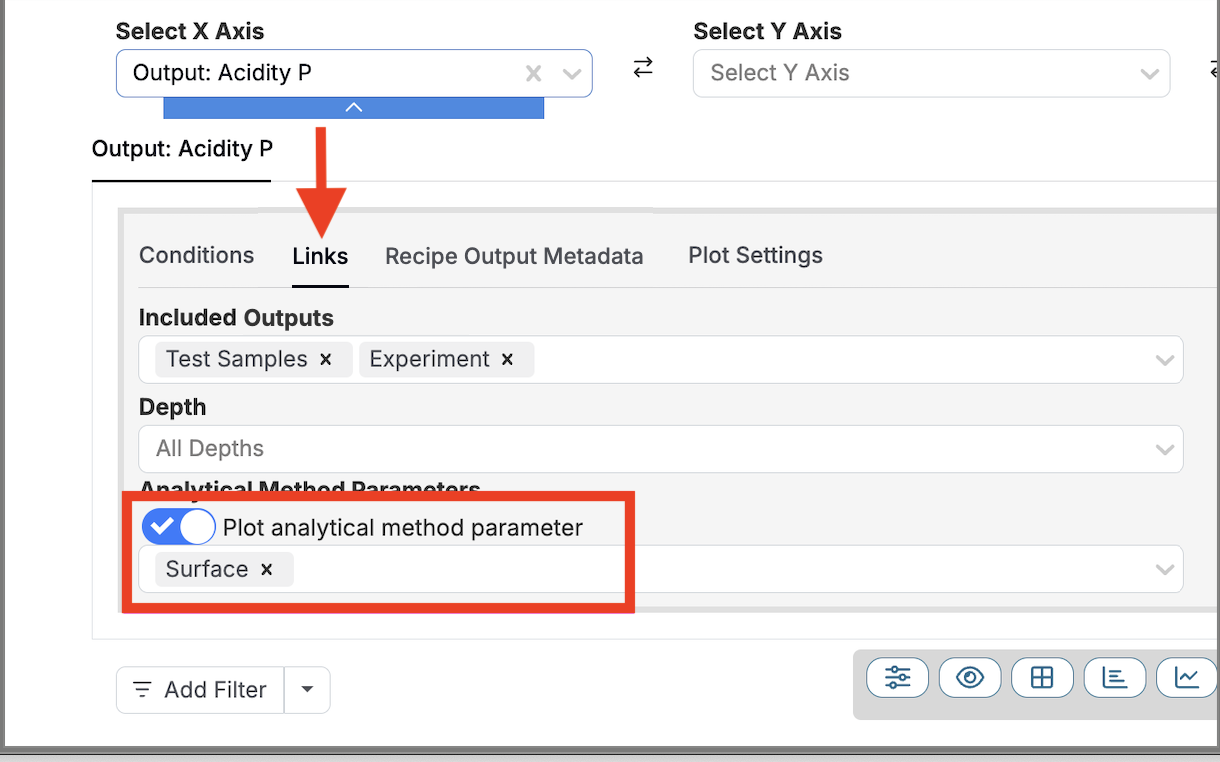
Plotting Enabled for Analytical Method Condition Parameters (AMCPs)
A recent update enables Uncountable users to plot inputs and outputs stored onAMCPs when plotting on the Explore Data page.
- Plotting Inputs: To plot an input (aka an ingredient or process parameter) from an AMCP, select “Condition Parameters” from the dropdown menu. After choosing the condition parameter (i.e. surface), select an Analytical Method option by choosing “Inputs” and the relevant input from the submenu.

Plotting Outputs: When plotting outputs, enter the desired output name in the axis selector. Then, under the Links tab, toggle on “Plot analytical method parameter” and select from the AMCP submenu.
‘
This update enables users to visualize and analyze data directly from the AMCP, improving your data analysis and decision-making capabilities.
Improved Experiment Group Selection on the Dashboard
We’ve made a recent update to the dashboard behavior when selecting experiments in experiment groups. Previously, when you clicked the “Select All” checkbox for an experiment group, the individual experiments within the group were not automatically selected unless the group was expanded.
Now, when you select the “Select All” checkbox for an experiment group, all experiments within the group will be included, even if the group is not expanded. This ensures a more intuitive selection process.


8/17/24
Support for Multiple Date Formats on the Enter Recipe Page
Uncountable now supports multiple date formats on the Enter Recipe page, accommodating various regional preferences. Previously, dates had to be entered in the US format, but with this update, users can now input dates according to their local format.
When entering a date, clicking on the cell will display a window with a list of available date formats based on your region. Other features, such as the “set to now” function (accessible by clicking the clock icon) and the “clear” option (via the X icon), remain unchanged.

Updated Calculation Column Selection on Enter Recipe Page
Improvements to the way users select calculation columns on the Enter Recipe page have been introduced to reduce clutter for customers who use a large number of calculations. Previously, calculations were chosen from a dropdown menu, but having too many calculations led to some options being clipped off.
Now, users can click “Calculations” and select “Select Calculation Columns,” which opens a modal displaying all available calculations. Within this modal, users can search, filter, and easily add or remove columns. Additionally, the “Toggle by Tag” feature allows for bulk adding of calculations associated with a specific tag.


Live Update Mode for Notebooks and Dashboard Notebooks
A new feature within Uncountable’s Notebook and Dashboard Notebook tools supports periodic data refreshes, ensuring that listings and visualizations stay up-to-date.
To use this feature, select “Toggle Live Mode” from the File menu within your Notebook. This enables Live Update mode, where the Notebook refreshes automatically every five minutes. A banner at the top of the screen will display the Last Update Time and the Next Update Time. Users also have the option to manually refresh the data at any time by clicking “Refresh Now.”


Run Rules in Notebook Visualizations
Run Rules have been introduced to the Uncountable Notebook and Notebook Dashboard visualizations, providing a way to monitor and enforce statistical standards during R&D processes.
When testing whether data points fall within certain parameters, industries often rely on specific statistical standards, such as SQC and ASTM. Run Rules help identify points that fall outside these statistical norms.
Enable Run Rules by clicking the cog icon within a Notebook visualization and selecting “Control Settings.” From there, select from the SQC and ASTM multi-select menus. Once added, data points that violate run rules will be marked on the graph and hovering over them will display which rules were violated. Additionally, a table displayed beneath the visualization provides a detailed summary of any violations.


Enhanced Experiment Copying Options on the Enter Recipe Page
Several improvements have been introduced to the way experiments can be copied on the Enter Recipe page. Users now have the option to “Copy Active Experiment,” which duplicates the experiment being worked on, or “Copy All Experiments”, which copies all experiments in view.
Additionally, when copying an experiment that includes an ingredient with “Autofill” behavior, a new advanced setting within the Copy Experiment modal allows you to “Convert Autofill to Standard Behavior”, removing the autofill behavior for the copied experiments.


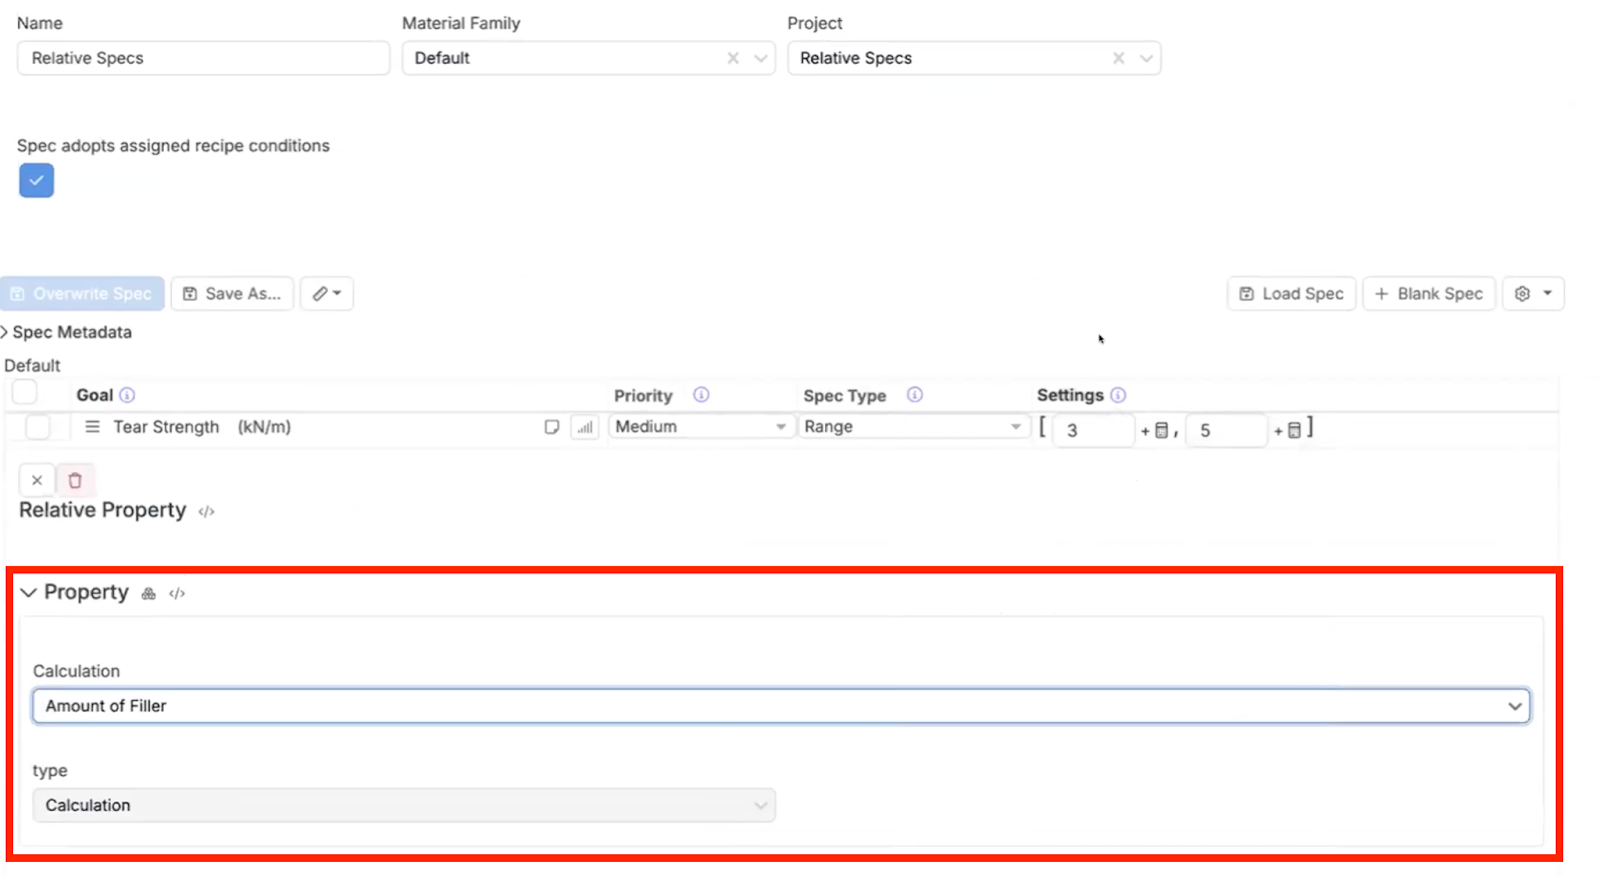
New Relative Properties Feature for Numeric Output Spec Goals
The new “Relative Properties” feature for numeric output spec goals offers enhanced flexibility in goal setting. You can now add relative properties to a spec by clicking on the spec goal on the Spec page and selecting “Configure Relative Properties” from the dropdown menu.
Where specs were previously limited to numeric values or ranges, you can now select a calculation under the “Property” header to serve as a relative property. The spec goal will then be displayed as a base value plus the chosen calculation. For example, if “Amount of Filler” is selected, the spec goal will be shown as the base value plus “Amount of Filler,” allowing for a more dynamic and adaptable approach to managing goals.


Updated UI for Adding Condition Parameters to Output Filters
The user interface for adding condition parameters to output filters has been updated for a more streamlined experience.
Previously, the window featured two sides with similar functions—one with a dropdown menu and another displaying available parameters. The new design consolidates this into a single, more efficient interface, migrating the functionality to the right side.
Users with existing saved filters can continue using the old parameters until they are removed; after which, they will need to switch to the updated filter selections. This update aims to simplify parameter selection and improve overall usability.


New user interface when adding condition parameters to output filters, featuring a more consolidated design.
Enhanced Output Groups and Test Samples Differentiation in Lab Requests
Lab requests now feature improved visual differentiation between output groups and test samples. Previously, indentation under measurements was the primary method for distinguishing between these elements.
The updated interface introduces a colored border to clearly indicate test samples, with different colors used to distinguish between them. Output groups, in contrast, remain without borders. Nested test samples also utilize a slightly lighter border color to signify their nested status, enhancing clarity and within lab requests.

Enhanced Edit Workflow Page with Structured Listing Control
The Edit Workflow page has been upgraded to a structured listing control. While the functionality remains the same, the new layout offers a neater and more standardized user interface consistent with the rest of the platform.
Edit an individual workflow step by accessing the step’s dropdown menu (“…”) and selecting “Edit Workflow Step”, opening a side panel for configuration. Alternatively, click the blue “Edit Workflow” button to access the overall workflow editor.

The Edit Workflow page now features a structured listing, from which users can edit workflow steps and the overall workflow.
New Warning System for Inventory Limit Violations
Warnings have been added for inventory limit violations, by laboratory location. By default, this feature is turned off but can be activated for individual labs under “Lab Settings” within “Company-Wide Settings.”
When enabled, the system will display inventory limit warnings for specific labs and ingredients. If inventory is moved in a way that breaches a limit, a warning will appear notifying that the action will exceed the inventory limit. If multiple limits are violated, all relevant warnings will be shown. Note that the warning will only trigger the first time a violation occurs; subsequent actions that continue to exceed the limit will not prompt additional warnings.


Improved Time Series Stage Management in Visualizations
Improvements to the time series stage visualization page have been introduced to make configuration more efficient. Previously, users had to scroll through all relevant stages in the “Select Stages” dropdown menu, which could be cumbersome for users with many inactive stages.
Now, time series stages not actively used can be archived. To archive a stage, go to the time series stage listing, edit the individual stage by clicking the pencil icon, and select the “Archive” checkbox. Archived stages will no longer appear in the “Select Stages” dropdown on the time series visualization configuration page. Additionally, admins have the option to create new time series stages directly from the time series listing by selecting “Create New Stage.”

Archiving unused stages prevents clutter in the “Select Stages” dropdown menu when configuring time series visualizations.

Add Lines to Graphs on the Explore Visualizations Page
The Explore Visualizations page now supports advanced line customization, allowing users to add various types of lines, such as annotation lines, directly to their graphs.
To add a line to your visualization, select the Add Line button. Within this modal, users can add information such as axis intercept, line direction, style, color, thickness, and a label. This enhancement provides more options for highlighting and detailing key data points.


Default Lead Assignment for Output Groups
A new feature, default lead assignment, has been added to the Output Group page. Similar to configuring a default Duration for Tasks, this update allows you to set a default lead for the output group.
To add a default lead, navigate to the output group page and select from the Default Lead dropdown menu. When setting up a task in a lab request, adding that output group will now automatically add the lead as the assignee, simplifying the process of task assignment for lab requests.


Autofill Lots Based on Inventory Amount Selection
A new feature has been introduced to streamline entering Inventory Amount and Lots data on the Enter Recipe page.
When selecting an Inventory Amount, the system will now automatically autofill the corresponding Lots. This enhancement simplifies the process of associating lots with inventory amounts, making it easier to ensure accurate and consistent data entry.

8/2/24
Barcode Scanning for Product Selection
Barcode scanning has been added to the Enter Recipe page when Products are used to define inputs.
When the product selection field is empty, you’ll now see a barcode icon– clicking this icon opens the barcode modal. If the field already has a value, access the barcode scanner by opening the cell’s dropdown menu and selecting “Barcode Scanner.”
Within the barcode modal, tap the camera icon to scan barcodes directly with your device’s camera. Additionally, we’ve also added a text field for using a hardware scanner wherever barcodes are accepted.


New Ingredient Inventory History Page Features
We’ve recently revamped Uncountable’s Inventory History page by converting it into a listing and adding a plot view.
Now, from an ingredient’s individual Inventory History page, users can search, sort, and add and adjust filters such as Location, Lab, and Units. Adding filters updates the listing and the associated plot update in real-time, enabling better tracking and visual analysis of the ingredient’s history.

New Ingredient Subcategory Swap Behavior
A new subcategory feature has been introduced to support swapping ingredients within the same subcategory, as a step to change and improve the chemically similar ingredients functionality.
By default, ingredient subcategories swap behavior are set as not available. To enable this feature, navigate to the Ingredient Subcategory page, and select “Swap Available” for the desired ingredient subcategory under the Swap Behavior column. Now, from the Enter Recipe page, users can click on an ingredient, select “Swap (Ingredient Subcategory)”, and select another ingredient from the dropdown menu.
This functionality has been introduced in an effort to move away from the previous “similar ingredients” concept, instead linking ingredients through subcategories.


Test Sample Link Type Added for Output Calculations
Uncountable users can now add a Test Sample Siblings link type when configuring an output calculation, allowing values to be pulled automatically from sibling samples within the same parent experiment.
To do so, navigate to the Output details page and click Edit Calculation > Edit. Under “Pull Values From”, select “Test Sample Siblings”. Now, when adding the calculation to an Enter Measurement page, it will reference all sibling test samples within the experiment.
In the example below, an “Average Specific Gravity Among Test Sample Siblings” is used to determine the average specific gravity of three test samples derived from the same parent experiment.


7/26/24
Improvements to the Project Dashboard Layout
This week, we are excited to introduce Uncountable’s new Project Dashboard layout. While the general tools and functionality of the Project Dashboard page remain the same, a few minor changes have been introduced to reduce visual clutter and enhance accessibility.
Most notably, project name, along with links and buttons to lock/unlock, favorite, tag, comment, and access other tools, are now located at the top of the page.

Improvements to the Ingredient Details Page Layout
We’ve also made several changes to Uncountable’s Ingredient Details page, mirroring the styling from the project dashboard. These updates are merely to the visual interface, and tools and functionality of the Ingredient Details page remain unchanged.
You will now notice that the ingredient name, along with buttons to lock/unlock, favorite, tag, comment, and access other tools, as well links and as buttons to lock/unlock, favorite, tag, comment, and access other tools, are located at top of the page in the colored banner.

Improvements to the Lab Requests Page Layout
Similar changes to the visual interface can be noticed on the Lab Requests page.
Lab request name, date, project, and material family are now located at the top of the page within the colored banner. Additionally, links and buttons to lock/unlock, favorite, tag, comment, and access other tools can also now be accessed at top of the page.
Like the new Project Layout and Ingredient Details pages, updates to the Lab Request page are merely aesthetic and all tools and functionality remain the same.

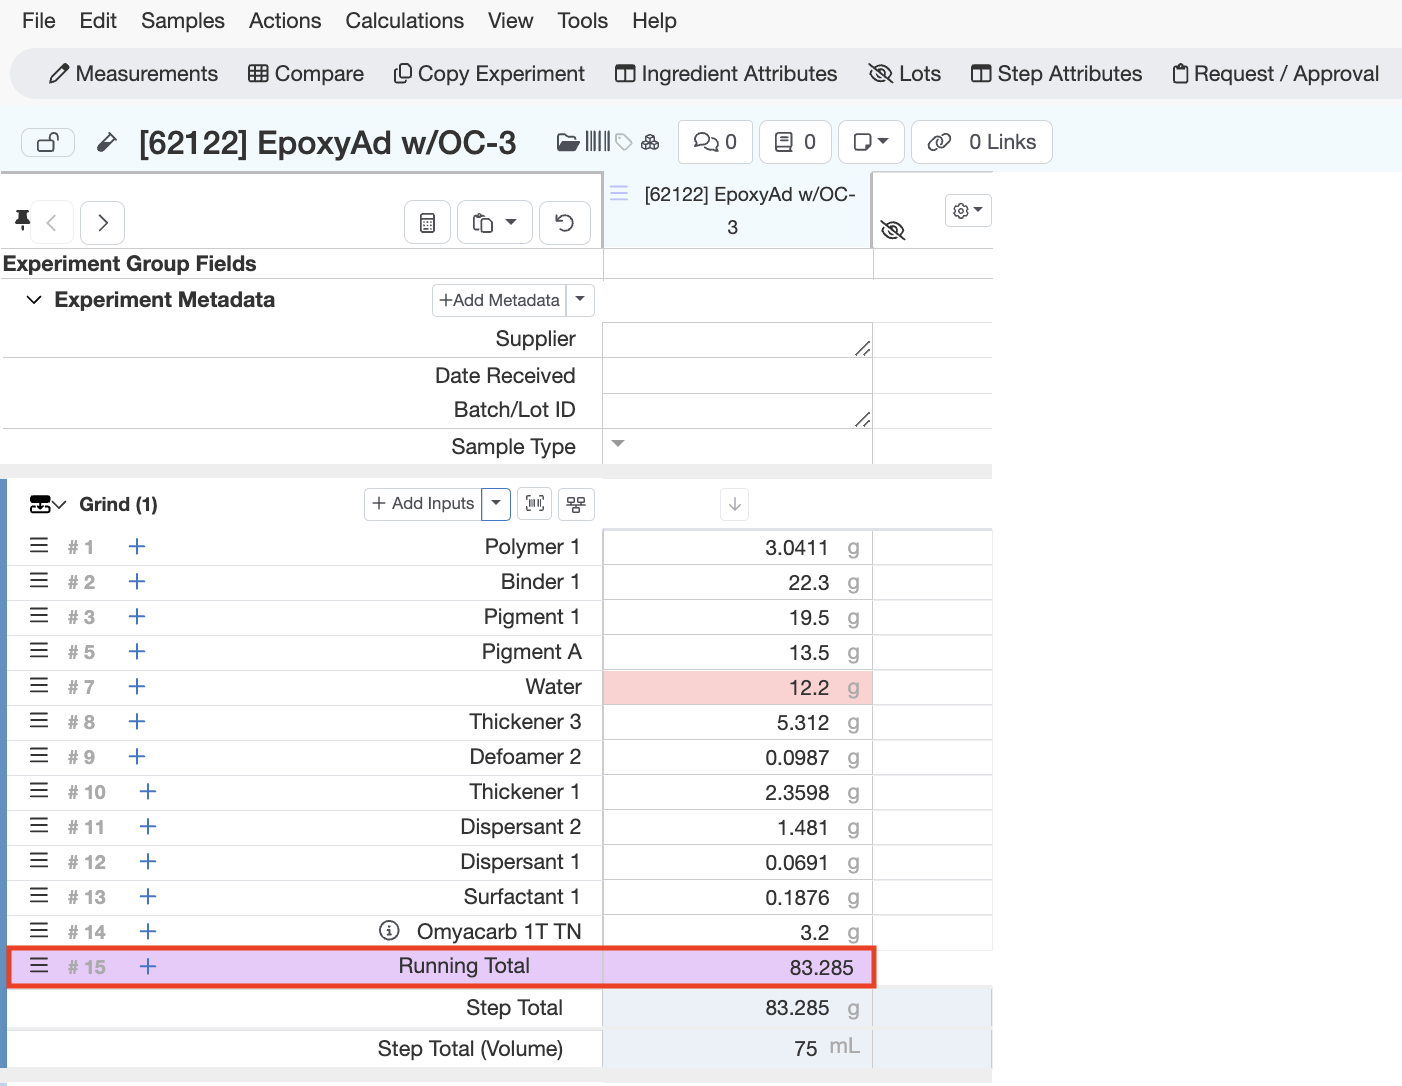
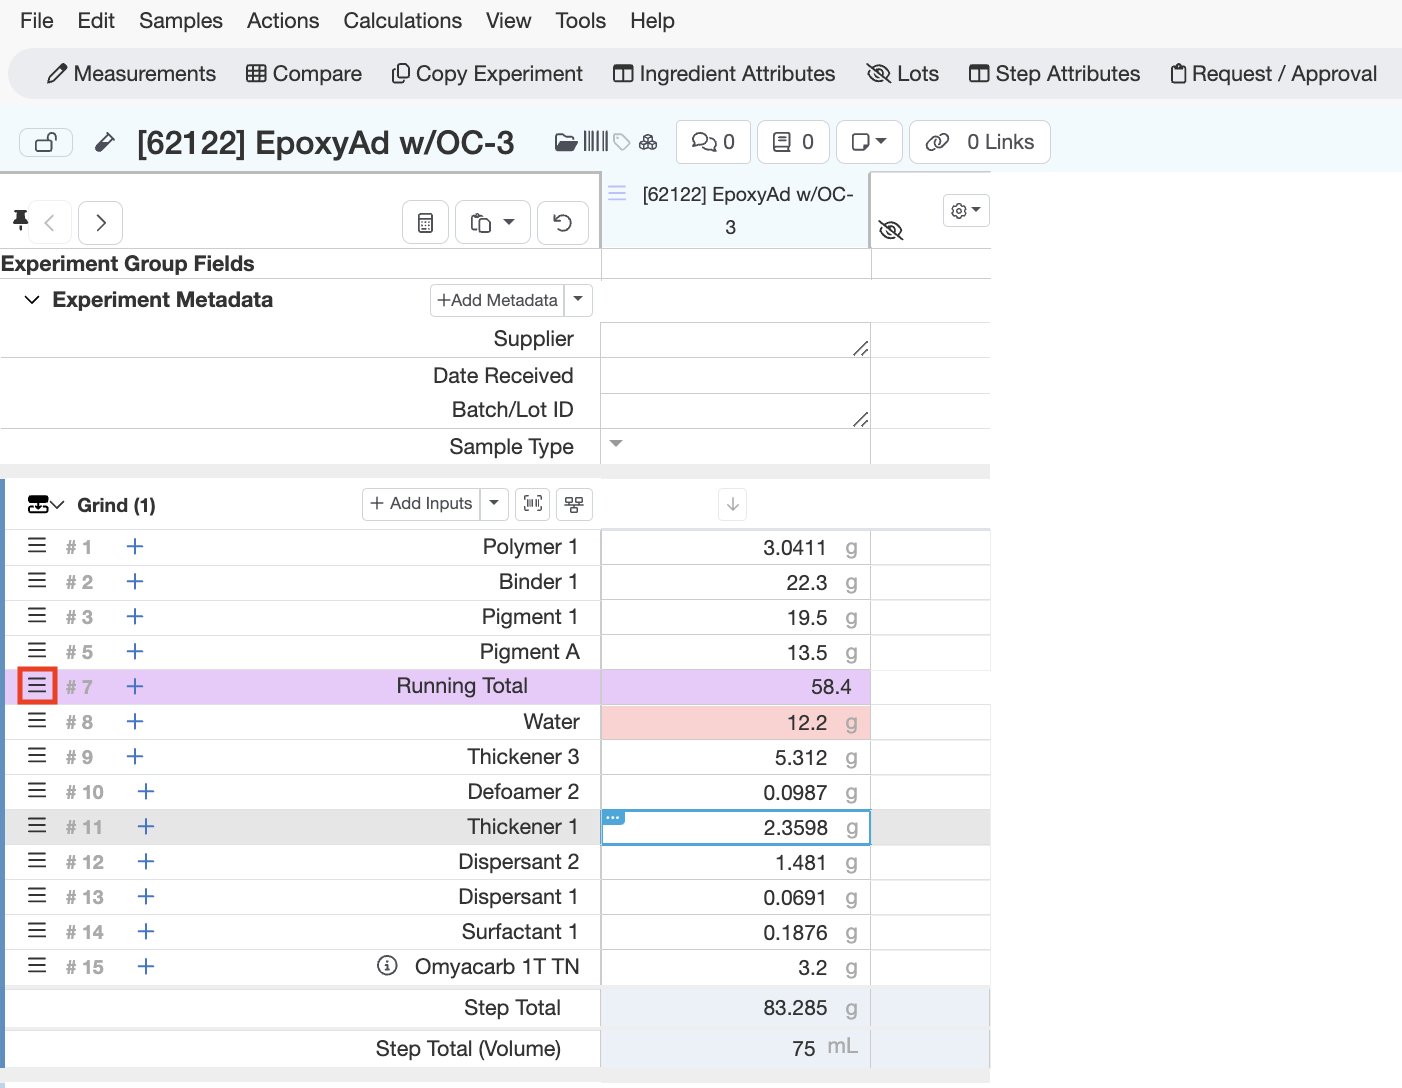
How to Add and Adjust a Running Total on Uncountable’s Enter Recipe Page
Uncountable users can now add a running total of raw materials on Uncountable’s Enter Recipe page. The running total sums all values above it and continuously updates as new values are added to the workflow step, unlike a subtotal which provides a sum for values in the step. You can also adjust the location of the Running Total row to sum only the raw material mass above it.
To add a running total to a step, follow these steps:
- From the Enter Recipe page, click the down arrow next to “Add Inputs” within a workflow step.
- Select “Add Running Total” from the dropdown menu.
- A new row for the running total will appear at the bottom of the workflow step.
- To adjust its location, click the three horizontal lines to drag and place it accordingly.
By keeping the Running total calculation visible at all times, Uncountable users can better monitor and manage the raw material usage in their experiments.

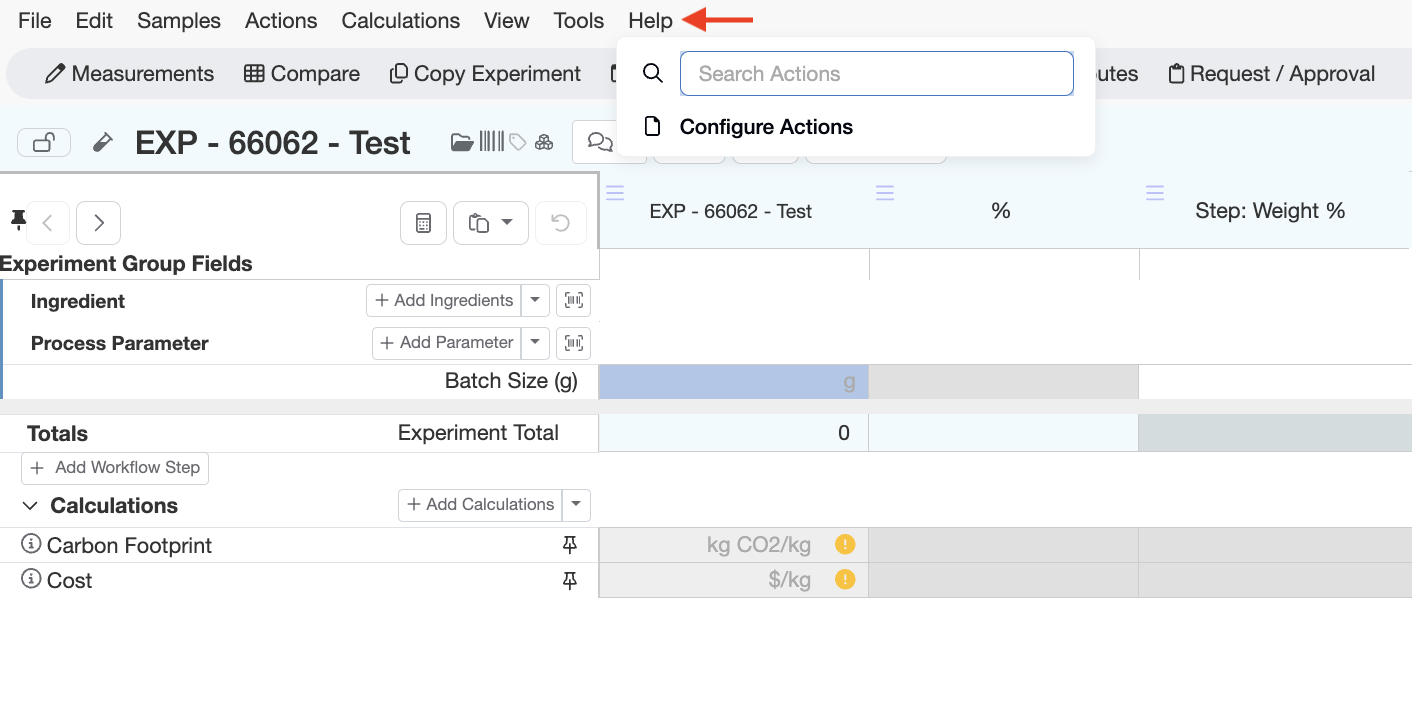
File Menu Option Added to Enter Recipe Page
Uncountable’s Enter Recipe page now can utilize a File menu styling option that is toggle-able at the schema level (aka across all material families). This enhancement organizes all Enter page actions by functionality, offering a more intuitive user interface similar to applications like Microsoft Office.
Essential tools and features remain the same, now organized within the new File menu. Users can easily find actions using the search bar in the Help tab. Additionally, customizable Action buttons allow quick access to frequently used functions, which you can tailor under Help > Configure Actions.
To turn this on, please reach out to your Uncountable admin.


7/19/24
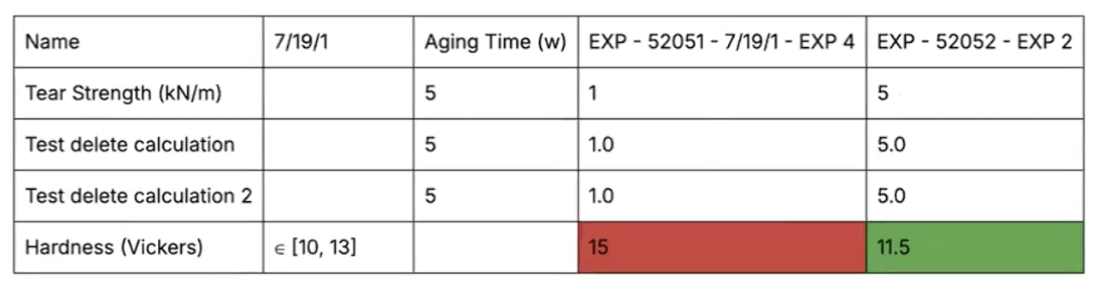
Spec Cell Coloring Added to Table Builder
There have been some recent improvements to Uncountable’s Table Builder tool that will make data management more efficient and visually organized.
Spec cell coloring has been introduced to enhance the visual organization of your data. You can now apply color coding to specific cells by passing in a family color and order, making it easier to distinguish different elements at a glance.


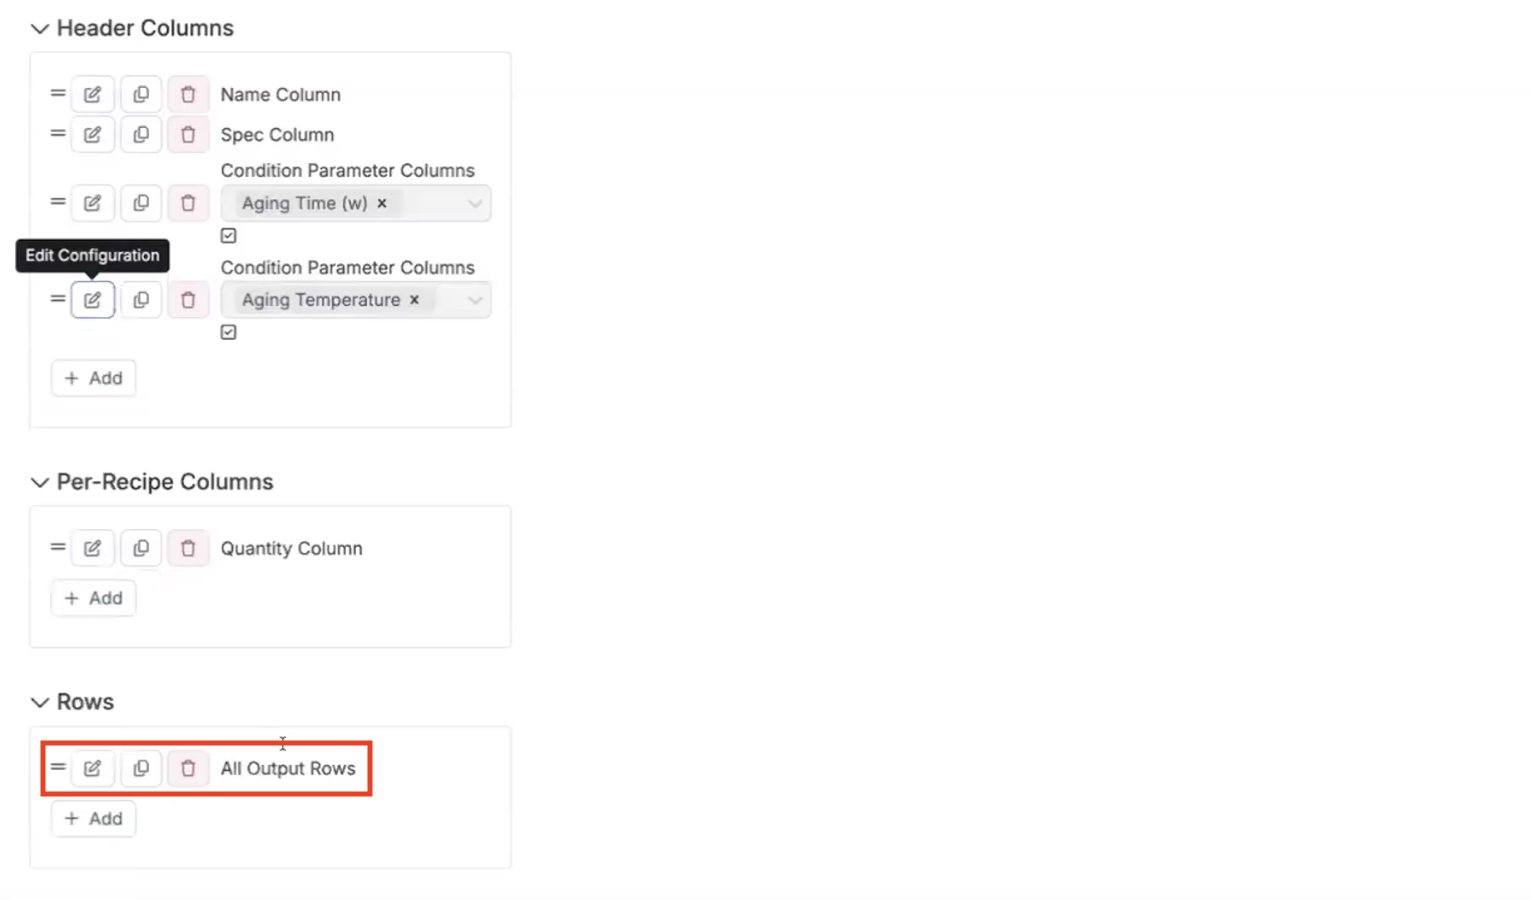
Skipping Condition Parameters in the Table Builder
Uncountable users can also now opt to skip condition parameters with no values when using the Table Builder feature.
For instance, if a parameter like aging temperature has no data, the corresponding column will be automatically removed from the table, reducing clutter and improving readability.


Removing Blank Output Rows from the Table Builder
Another useful update improvement to the Table Builder skips output rows that are blank.
If row settings are set to “All Output Rows” and any output row ends up blank, that row will be automatically excluded from the table. This ensures that your table remains clean and relevant, displaying only the data that matters.

View Workflow Step-Level Calculations on the Compare Page
Uncountable users now have the ability to view calculations within individual workflow steps on the Compare page, ensuring precise data tracking.
In addition to the workflow step-level, these calculations will also still be displayed in the Calculations section at the bottom of the Compare page when the setting is toggled on.

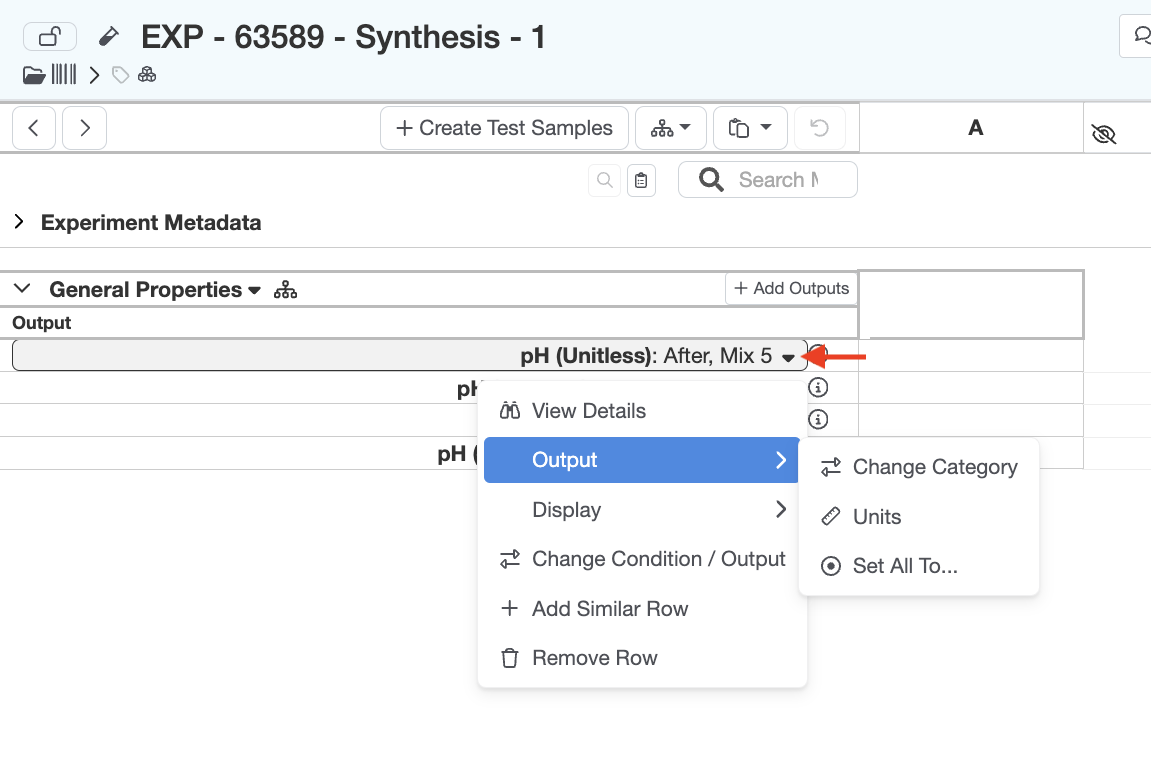
Outputs Dropdown Now Organized Into Submenus
A recent update enhances the Outputs dropdown menu on the Enter Measurements page. While the existing options remain unchanged, they will now be organized into intuitive submenus.
As we expand the range of options available to Uncountable users, this new structure will provide a cleaner and more organized interface, helping users navigate more efficiently through the growing list of choices.
Enhanced Customization with Step Attributes
From the Enter Recipe page, users now have the ability to add step attributes to instruction rows, ingredients in selection mode, and preceding workflow step cells.
This new feature provides more flexibility and detail in recipe creation, making it easier to manage and customize your workflows from the Enter Recipe page.

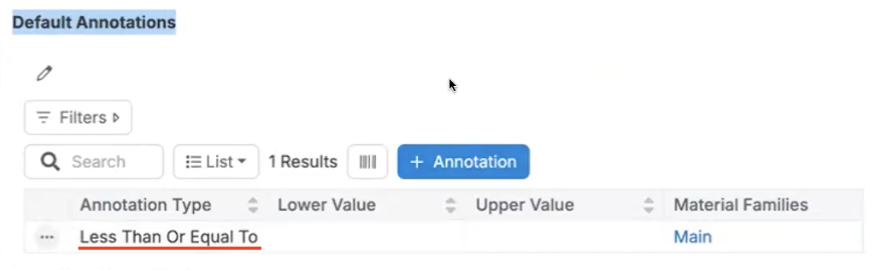
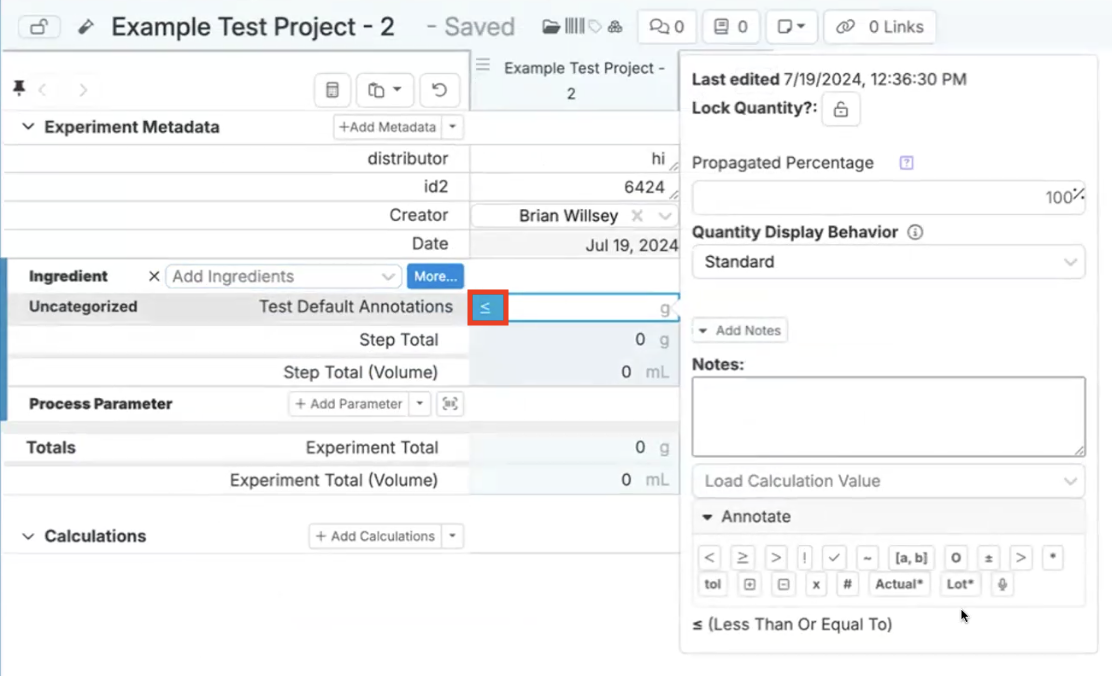
New Default Annotations for Ingredients
Add default annotations to ingredients on the Enter Recipe page with Uncountable’s new Default Annotation feature.
To use this new tool, navigate to the “Default Annotation” section of an ingredient page and add a new annotation. Now, when adding that ingredient to a recipe, these annotations will appear by default. You will also have the ability to edit the ingredient’s annotation like normal.
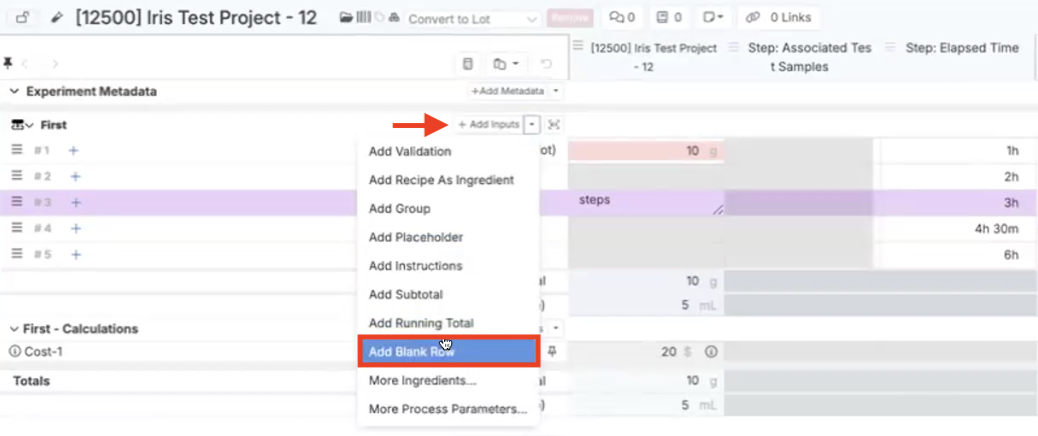
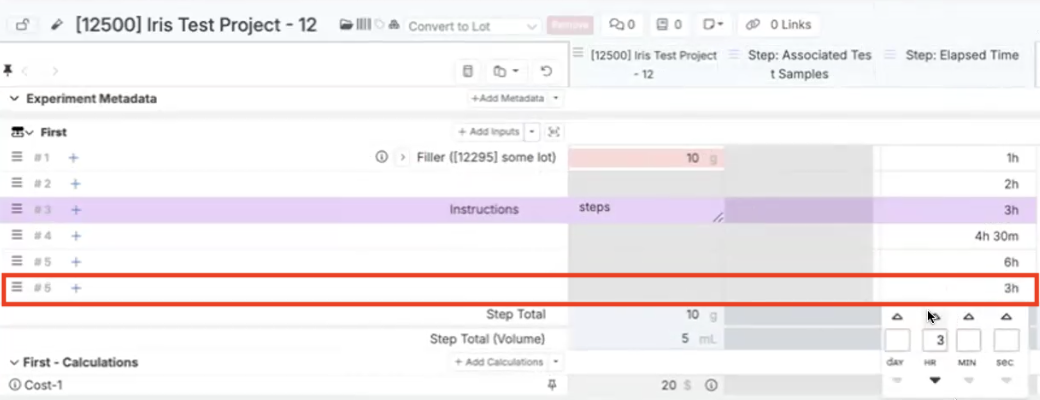
New Ability to Add Blank Rows to Enter Recipe Page
A recent update allows users to insert blank rows on the Enter Measurements page.
This enhancement is designed to allow you to add step attributes that are unassociated with data, such as ingredients or instructions, acting as a placeholder.
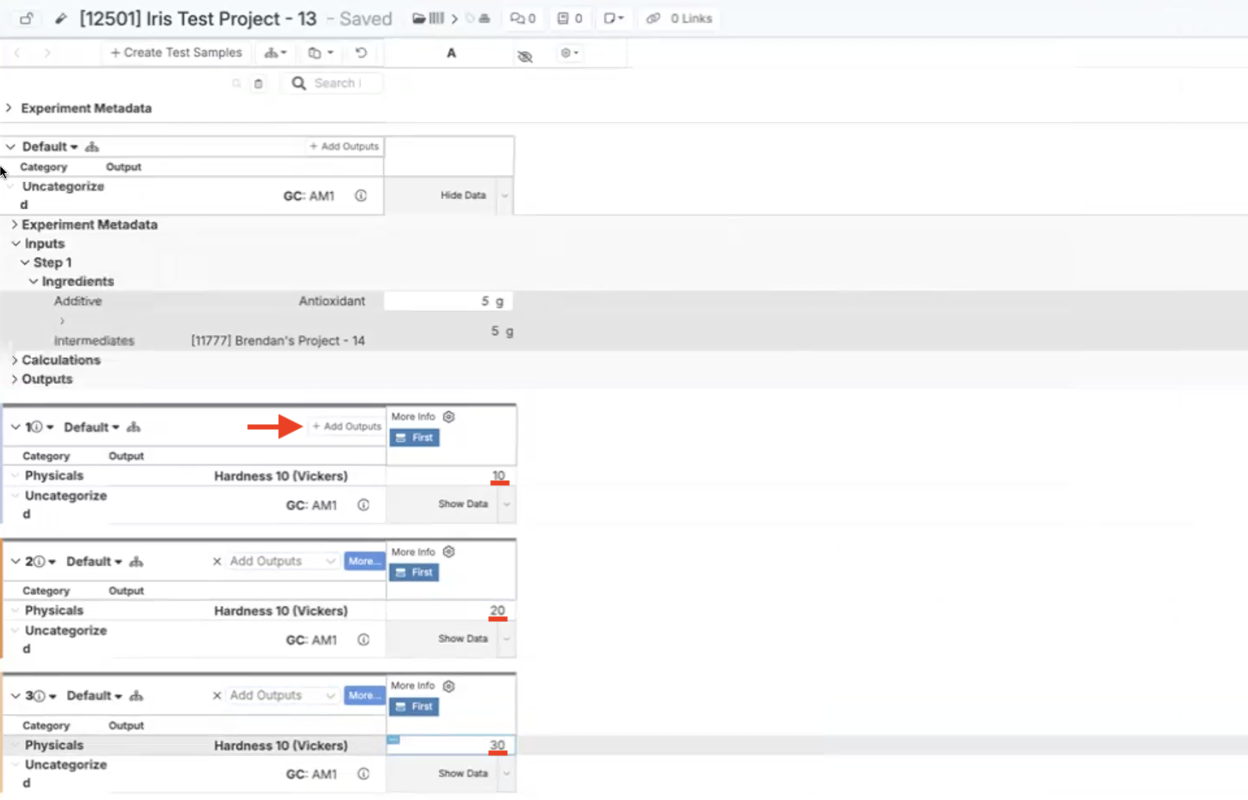
Visualizing Test Samples Against Step Attributes
A new Uncountable platform update introduces a feature for visualizing test samples by plotting any step attribute on the X-axis.
For example, if you have a step attribute such as “elapsed time”, you can now associate these with test samples on the Measurements page. This enhancement offers a deeper understanding of how step attributes impact your test results.
To do so, navigate to the Measurements page, create test samples, link them to specific steps (i.e. Elapsed Time), and add relevant outputs (i.e. Hardness 10). Then, navigate to Visualize > Explore Data and plot the associated step field against your desired output. Be sure to also split your test samples.


Enhancements to Ingredients Subcategories Listing
Recent improvements to the ingredients subcategories listing have removed most of the custom UI and made ingredients and parent categories are editable directly through the side panel.
From the side panel, you can perform actions such as adding subcategories or modifying existing ones. Previously, changes required navigating through a special modal. This update simplifies subcategory management, enhancing overall usability.

New Input Groups Structured Listing
Uncountable has recently made improvements to the input groups listing by converting it to a structured listing format.
Now, all tabs of the Inputs page are displayed as structured listings. This update enables Uncountable users to view, sort, filter, and manage input groups more efficiently.

Additions to the Input Groups Listing
Changes to Uncountable’s new input group listing include the addition of Group Size, Shared, and Edit columns.
To use these new features, navigate to the Groups tab of Uncountable’s Inputs page. From there, columns display input group information such as group size and favorite or shared status. Click “Edit” to open an input group’s page, where users configure settings, add inputs, or share the group.


Improved Composite Calculation Terms Display
Another key update to Uncountable’s Enter Recipe page is the enhancement of calculation terms for composite calculations.
Previously, terms in the popover displayed as generic placeholders like C0 + V1. Now, they accurately show the actual calculation terms in both the popover and the calculation side panel.
This update ensures that the denominator, numerator, and parameter terms are clearly visible, providing a more precise and user-friendly interface.

Help Menu and Toolbar Action Info Buttons
The new file menu configuration now includes info buttons for toolbar actions on Uncountable’s platform. Now, when you hover over or click the info button, you’ll see a description of what each button does.
This enhancement is a step toward creating an intelligent assistant for finding actions using the search bar. With this future update, Uncountable users will be able give a semantic query in the search bar, which will show you relevant actions, making it easier to navigate and utilize the platform’s features.

Recipe Data Side Panel Changes for Mobile Devices
Notes and annotations have been to the recipe data side panel, improving the mobile interface for Uncountable users.
From the Enter Recipe page, clicking on a cell displays recipe data in a popover. However, the addition of the recipe data side panel provides a more seamless and accessible experience when viewing and editing recipe data on mobile devices.

New Chemical Drawer Import Feature
A new addition to Uncountable’s Notebook page chemical drawer tool allows you to translate a chemical reaction drawing directly into an experiment by matching chemical diagrams and text entries.
The system scans the chemical drawer, matches diagrams, and identifies text based on name or CAS number. Once matched, you can import the data directly into your experiment, ensuring that all necessary ingredients are accurately included.
This enhancement streamlines the process of adding chemicals to experiments, making it more efficient and reducing the risk of errors.


New Color Output Import Feature
Uncountable users now have the ability to paste color values directly from Excel or Google Sheets into the Color Output modal.
Now, you can easily copy color values from your spreadsheets and paste them into the modal, and the values will be automatically updated. This enhancement simplifies the process of managing color data and ensures seamless integration with your existing tools.


Enhanced Date Calculations
Uncountable has recently upgraded our calculations feature to handle date-related outputs with more precision.
Previously, calculations involving dates could sometimes produce unclear or incorrect results, especially when separated or mixed with non-date data. With the latest update, date calculations are now more intuitive and accurate.
When creating a new date calculation, users can toggle on “Compound Through Preceding Steps”. This instructs the system to ignore non-date outputs and ensures that calculations are reliable and accurate.


Creator Column Added to Inventory Listings
The addition of a “Creator” column in inventory listings is aimed at enhancing inventory tracking within Uncountable. This update also includes a migration process to incorporate Creator IDs into existing inventory records.
Previously, older inventory records did not have Creator IDs associated with them. For new inventories, simply create them as usual, and the “Creator” column will automatically display the person responsible for the entry.
This update provides Uncountable users with the ability to see who created each inventory item directly within the structured listing, streamlining tracking and accountability.

Users with Read Permissions Now Have Override Capabilities
This week, Uncountable has introduced an update that allows users with “Read” experiment permission to also edit constraints and specifications.
For instance, an individual added to a specific user group can now not only read recipes but also override constraints and specifications as needed. This functionality is particularly useful for users who need to view and make adjustments to experiments without having full editing rights.
By implementing these permissions, we aim to give users more control over their experimentation process while maintaining secure access levels.
7/5/24
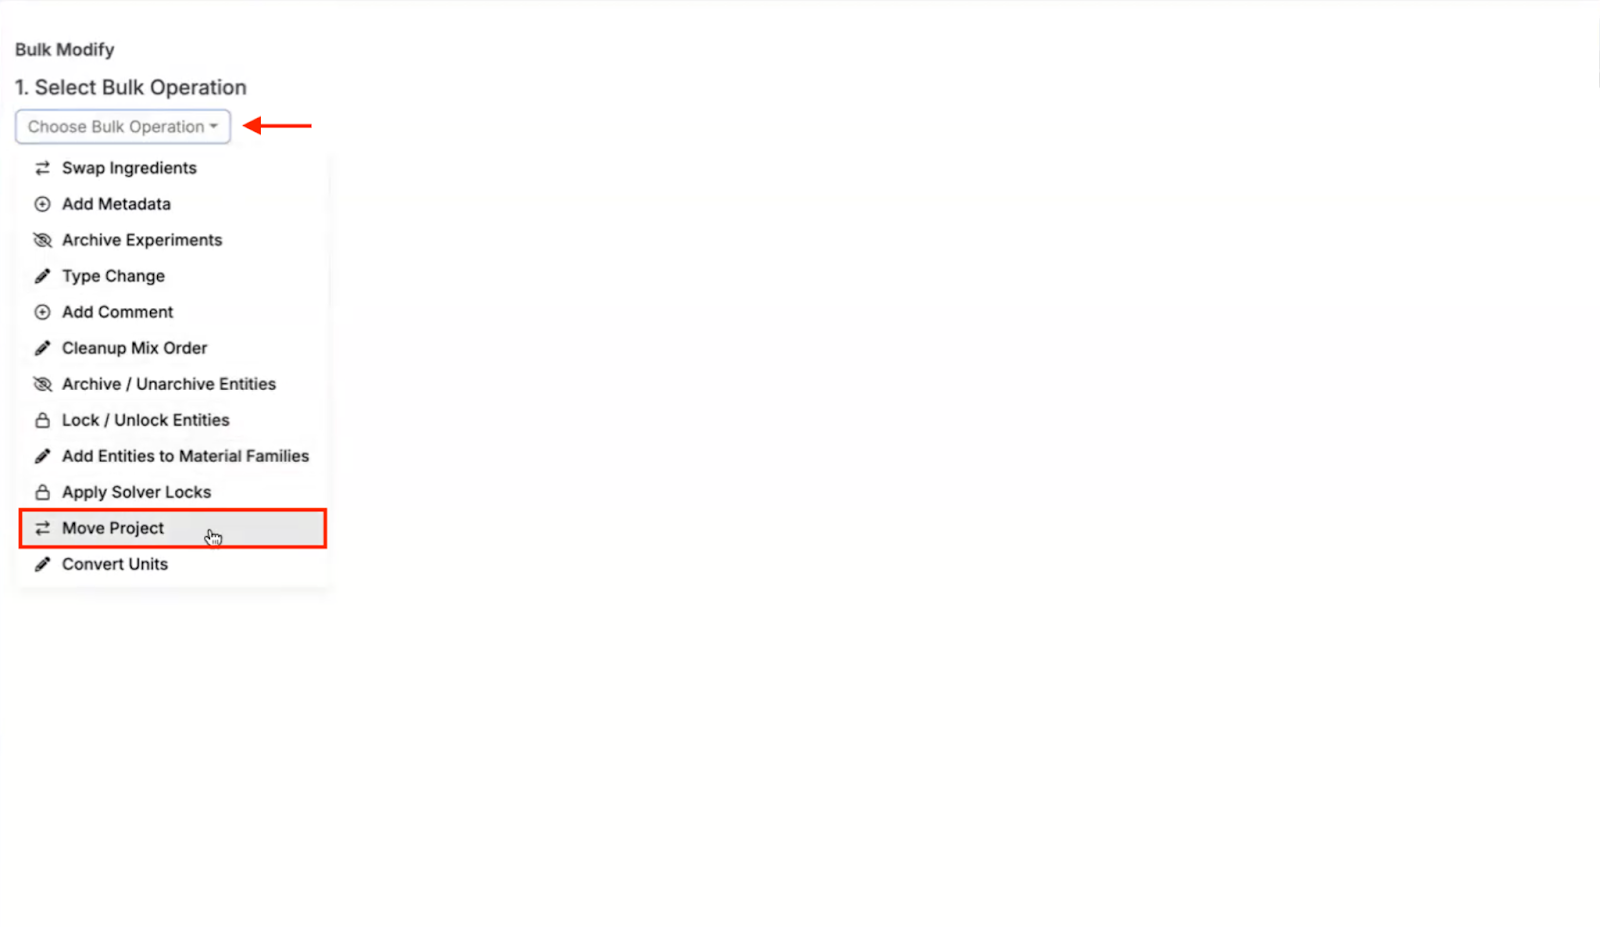
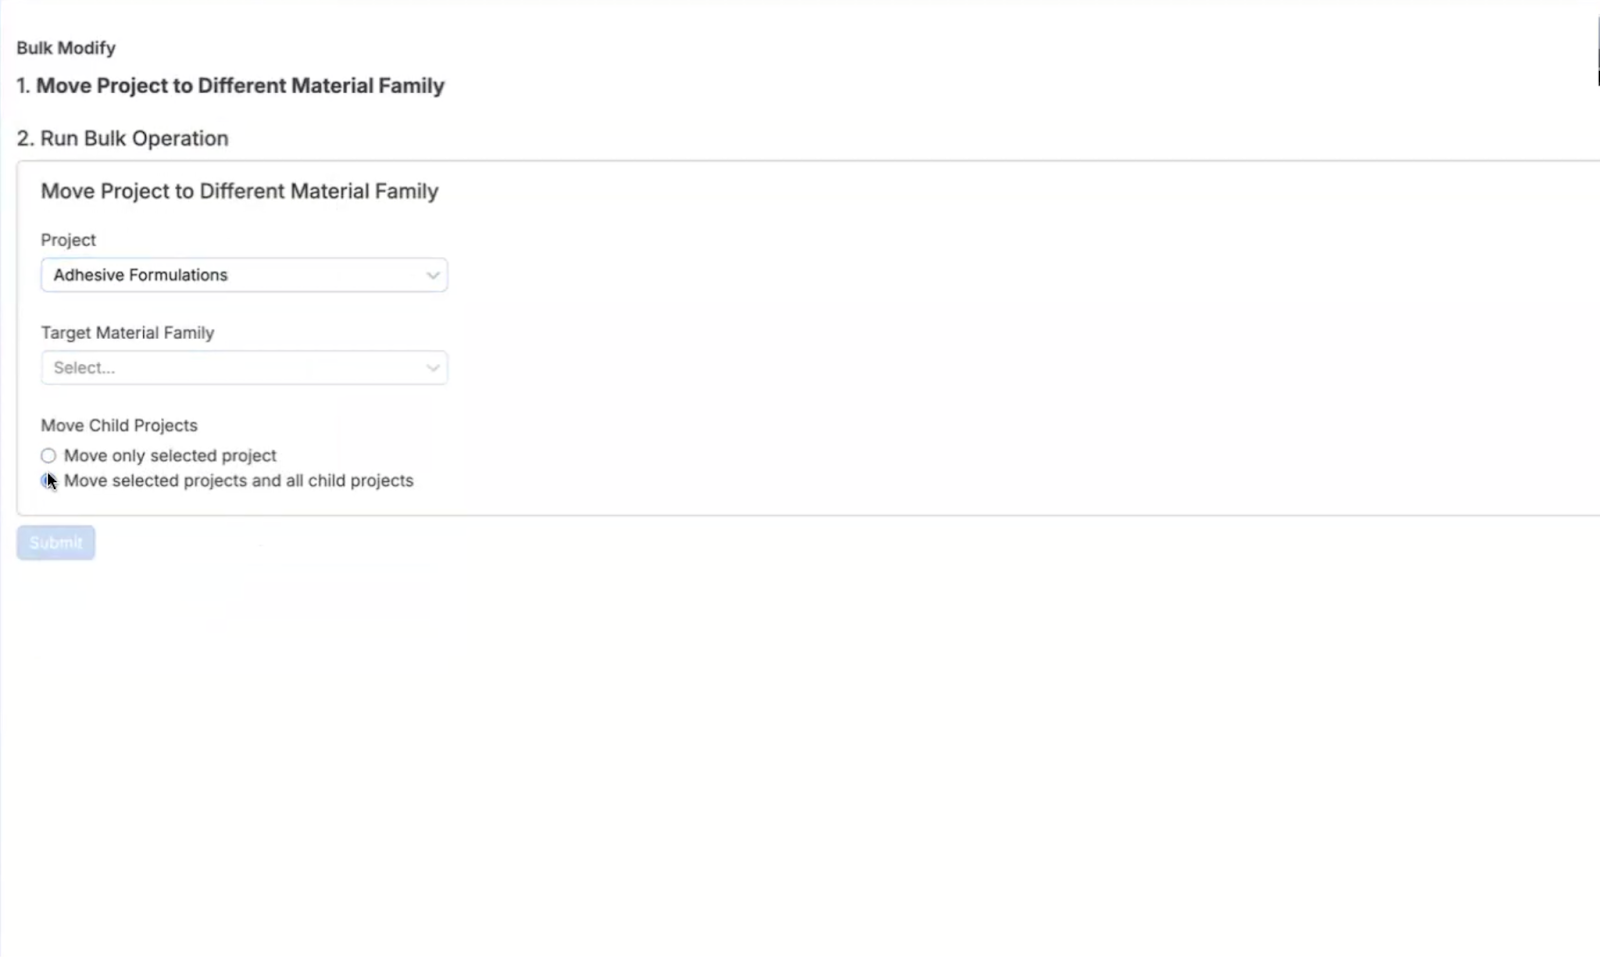
Move Project Bulk Modify Feature
A new Bulk Modify feature has been introduced, enabling users to move projects between material families.
This functionality includes the ability to select whether to move only the project or also its child projects. When moving projects, associated recipes and their contents are transferred, ensuring data integrity and continuity across material families.
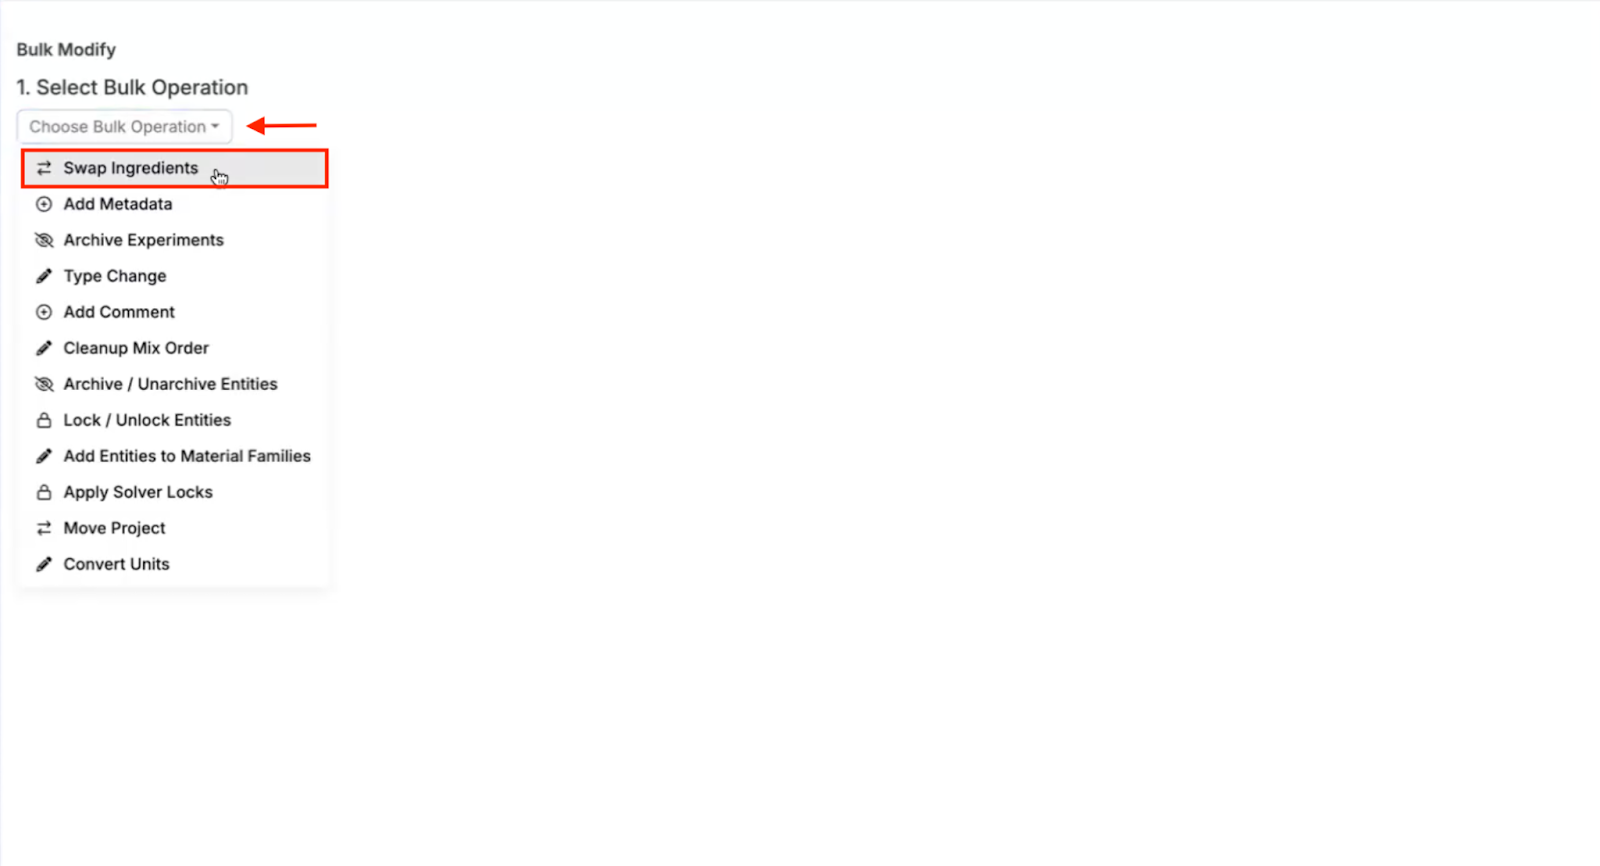
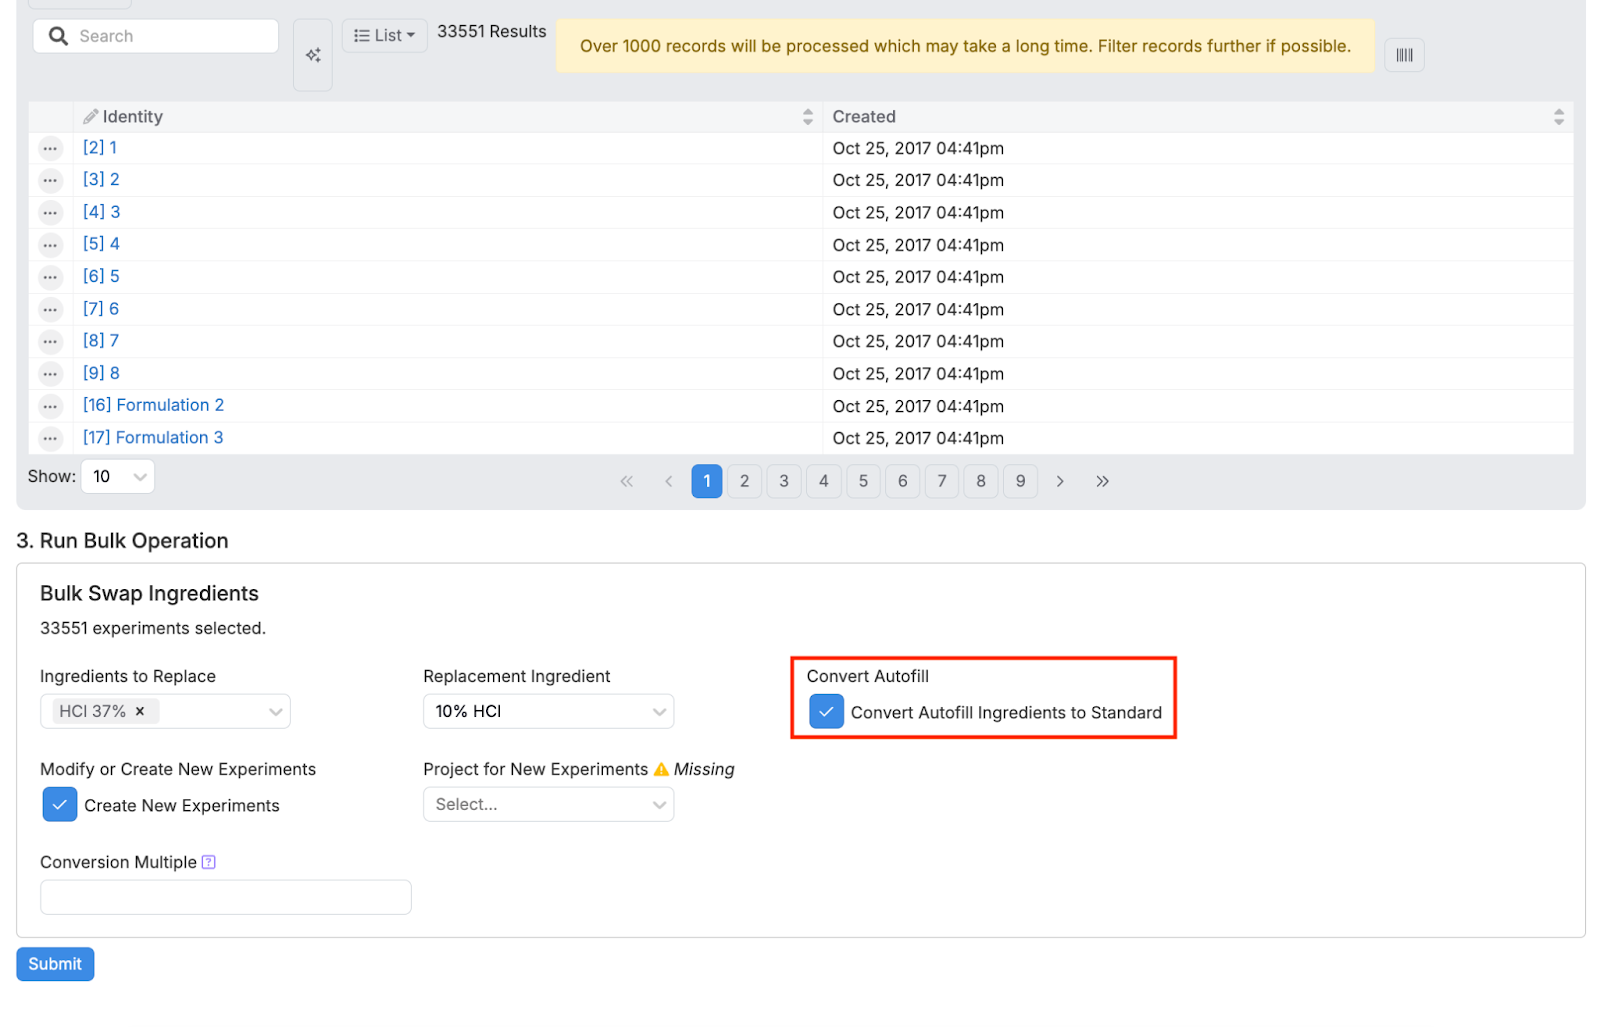
Update to Swap Ingredients Feature
The existing “Swap Ingredients” Bulk Modify feature now includes a new capability to convert swapped ingredients from autofill to standard types.
This update is designed to maintain consistency within recipes by ensuring that ingredients, when swapped, maintain standardization across all related experiments and data sets.
New Output Calculation Feature
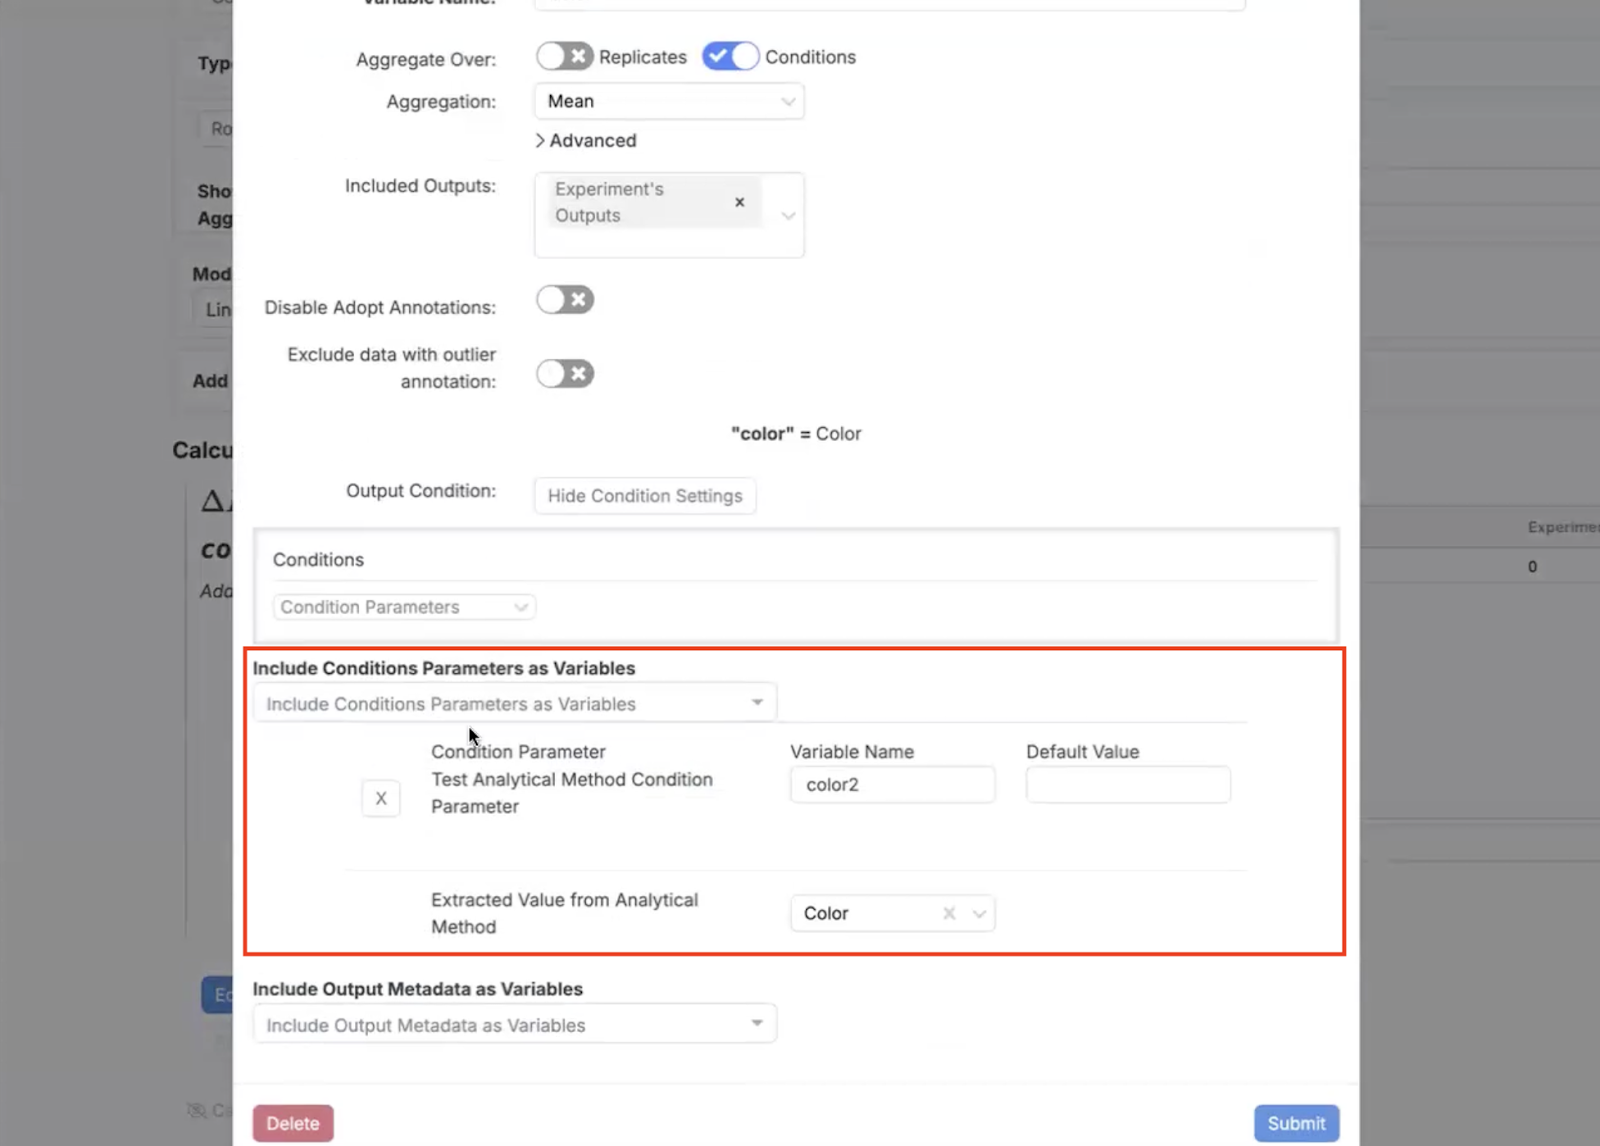
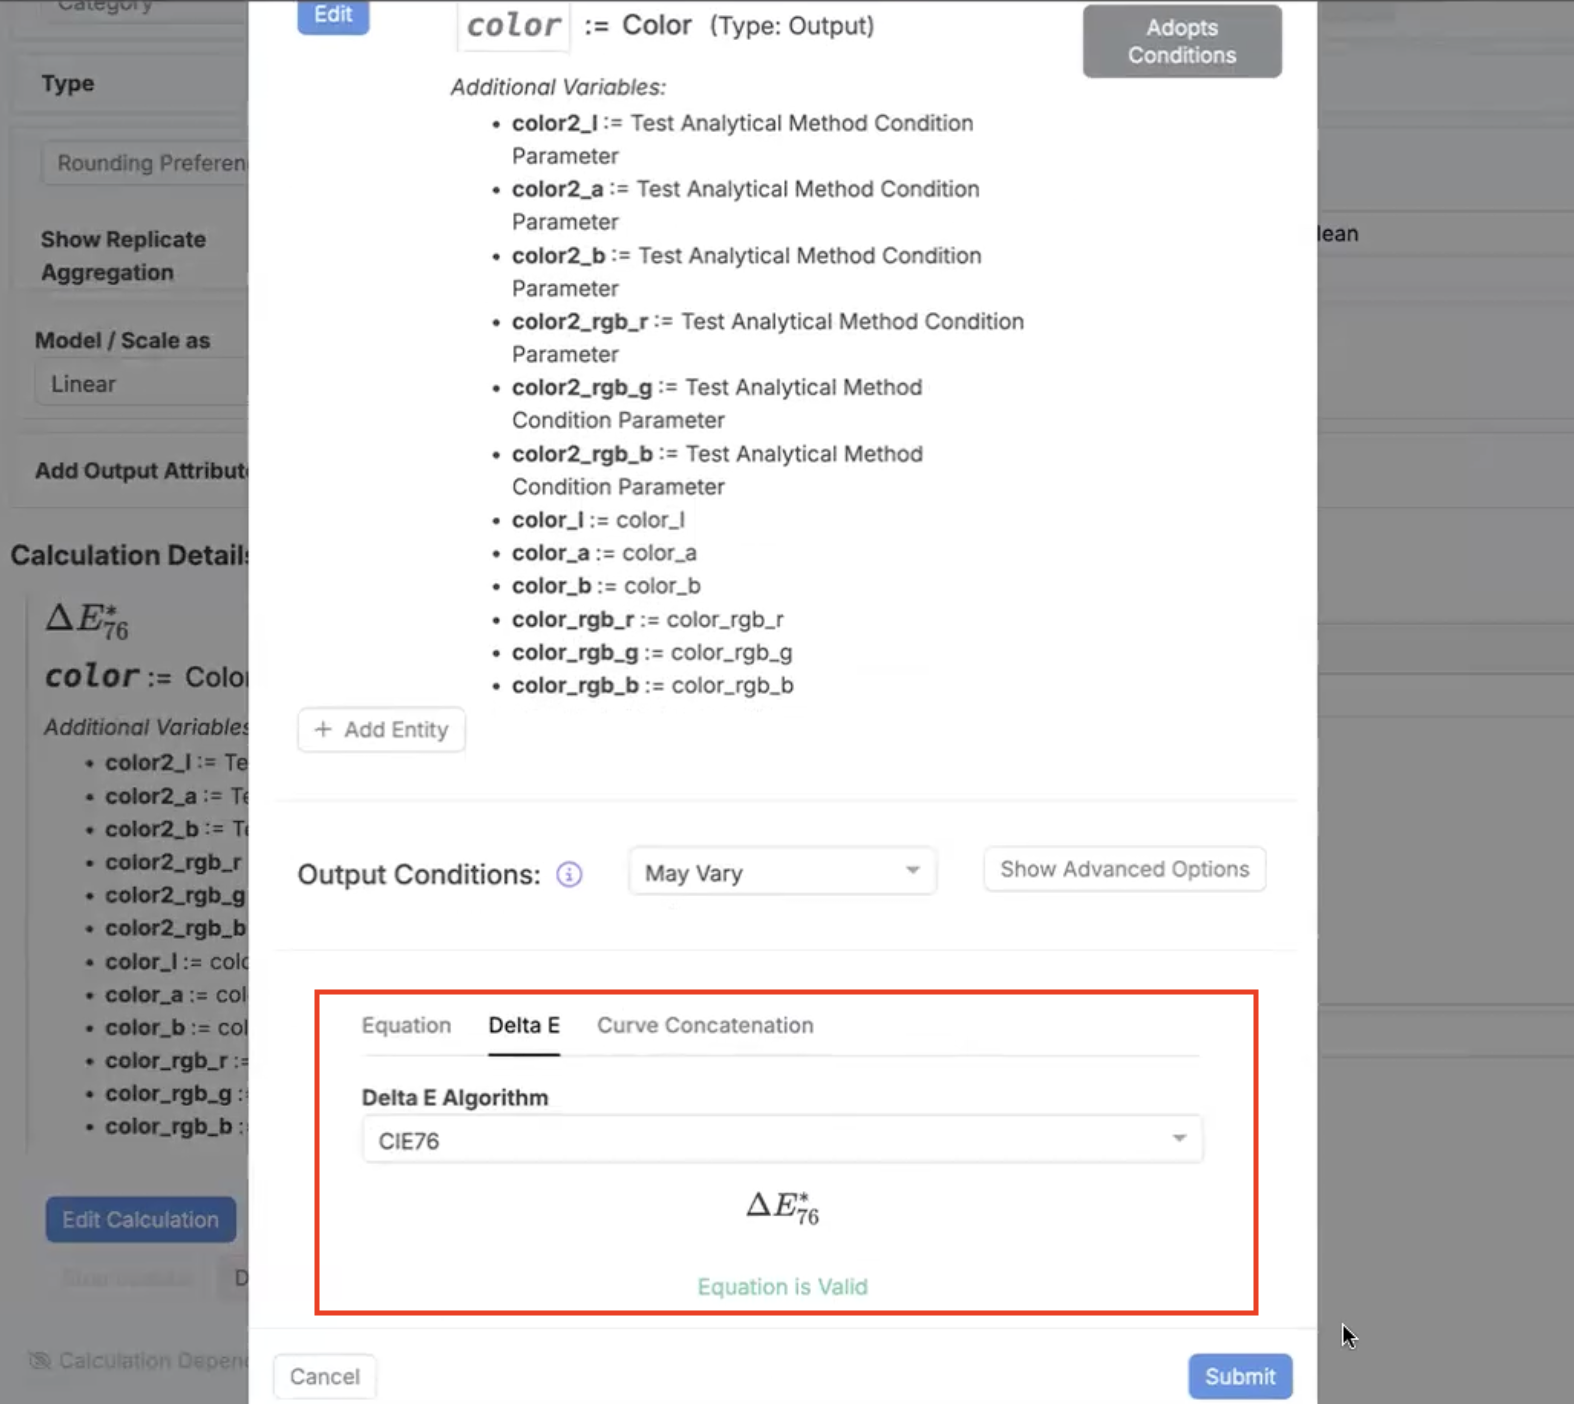
A new addition to the Uncountable platform enables users to pair Analytical Method Condition Parameters (AMCPs) with outputs.
This feature facilitates complex calculations, such as ΔE equations for comparing colors derived from specific analytical methods. Users can link analytical method parameters directly to recipe outputs, enhancing precision and data correlation in experimental analyses.
To use this new feature, navigate to the “Edit Output” page. Edit the output calculation, adding an AMCP as a variable. Select an output for that AMCP from the “Extracted Value from Analytical Method” dropdown menu. Then, create an output equation, using the experiment and analytical method outputs.
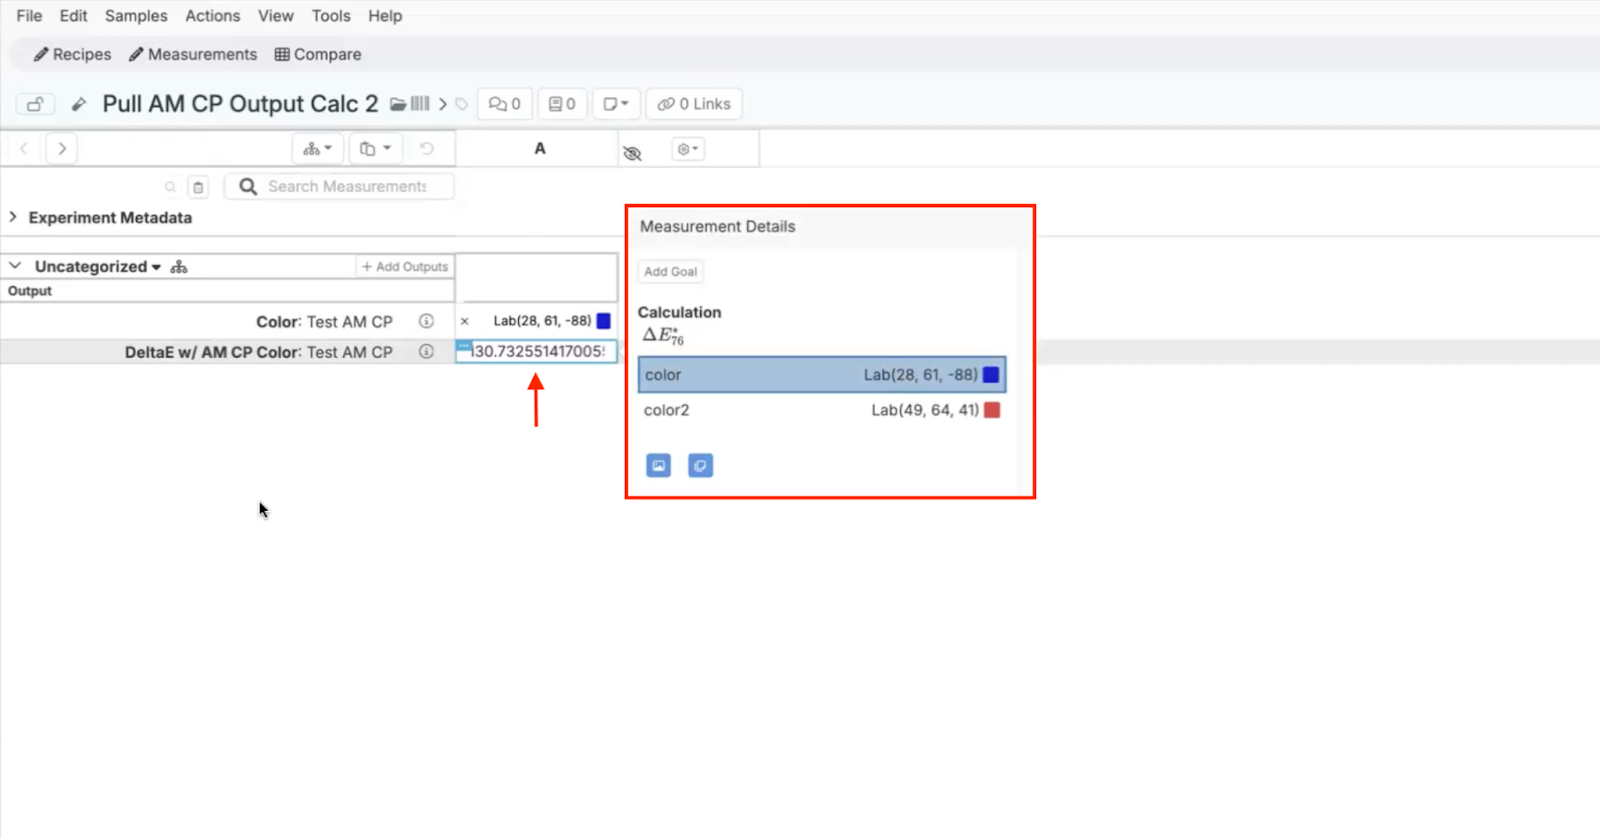
Once saved, the output will have a paired ΔE equation comparing the experiment output (color) and the AMCP output (color) on the Enter Measurements page.
Note: While this example uses a ΔE equation with color as outputs, you can use other equations with full numeric outputs as well.
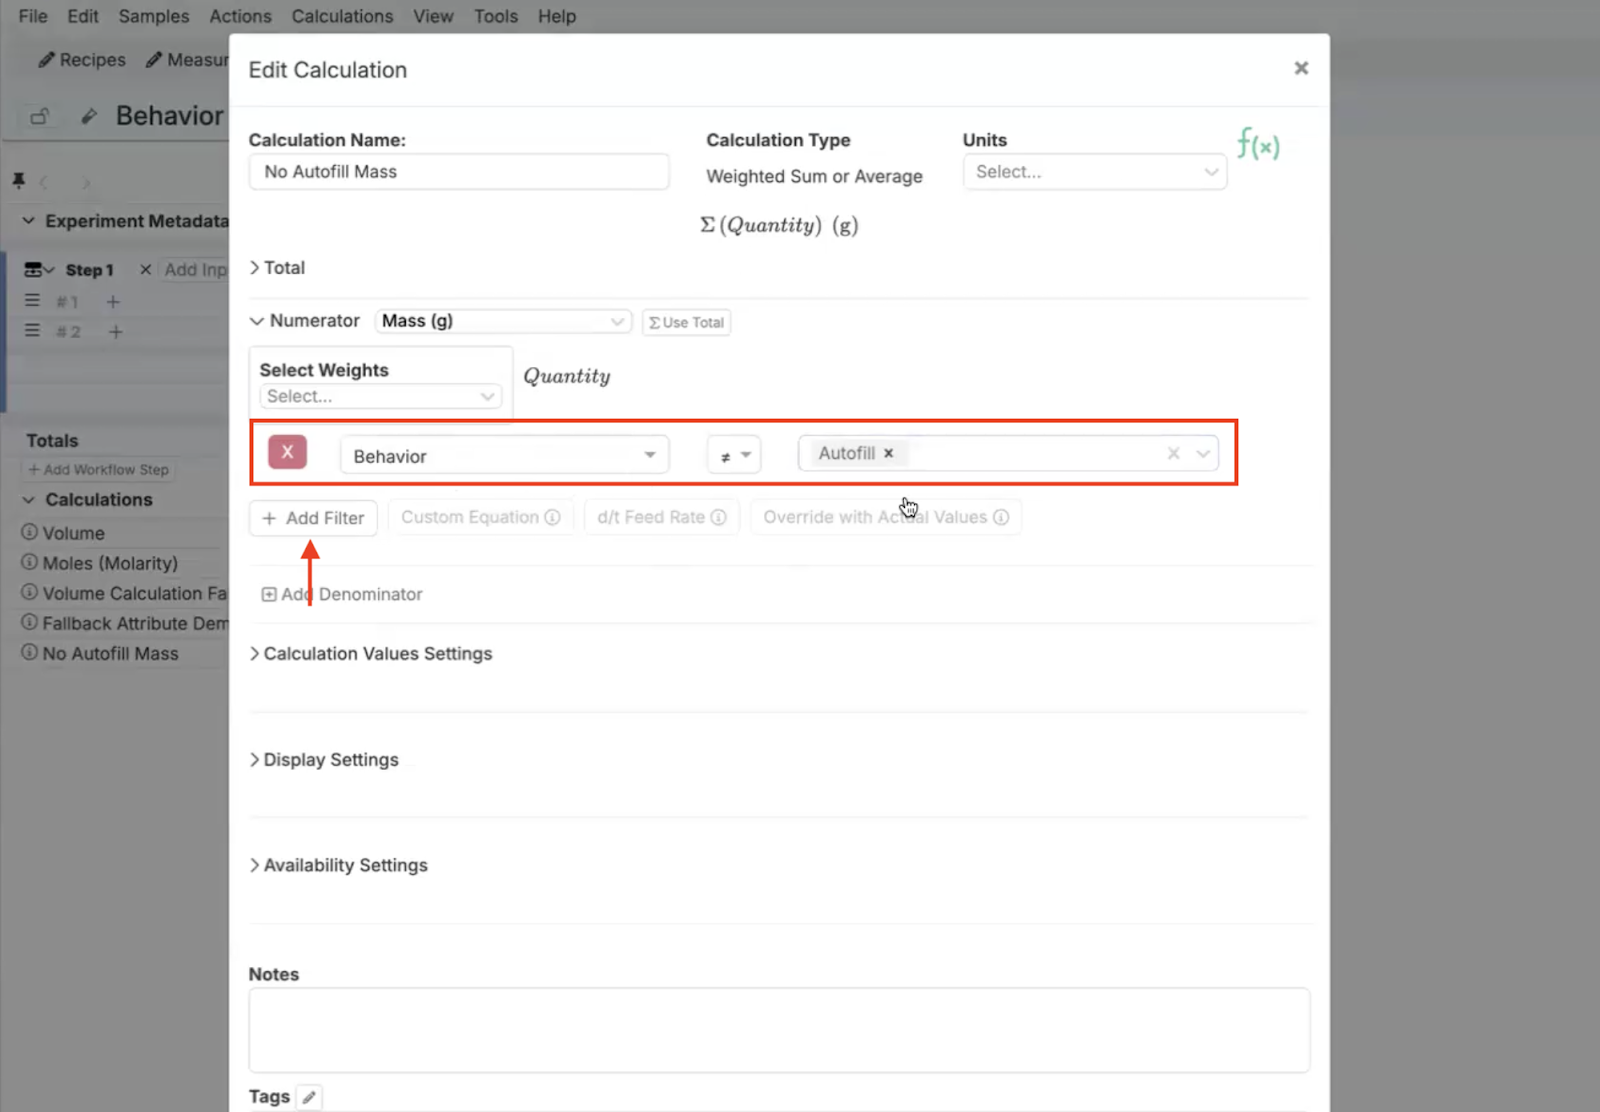
Filters on Recipe Ingredient Behaviors
Input calculations now support filters on recipe ingredient behaviors.
This new tool can be used to exclude auto-filled ingredients from calculations, ensuring that only relevant data is used in mass calculations and other analytical processes. This update improves accuracy and reliability in experimental data analysis and reporting.

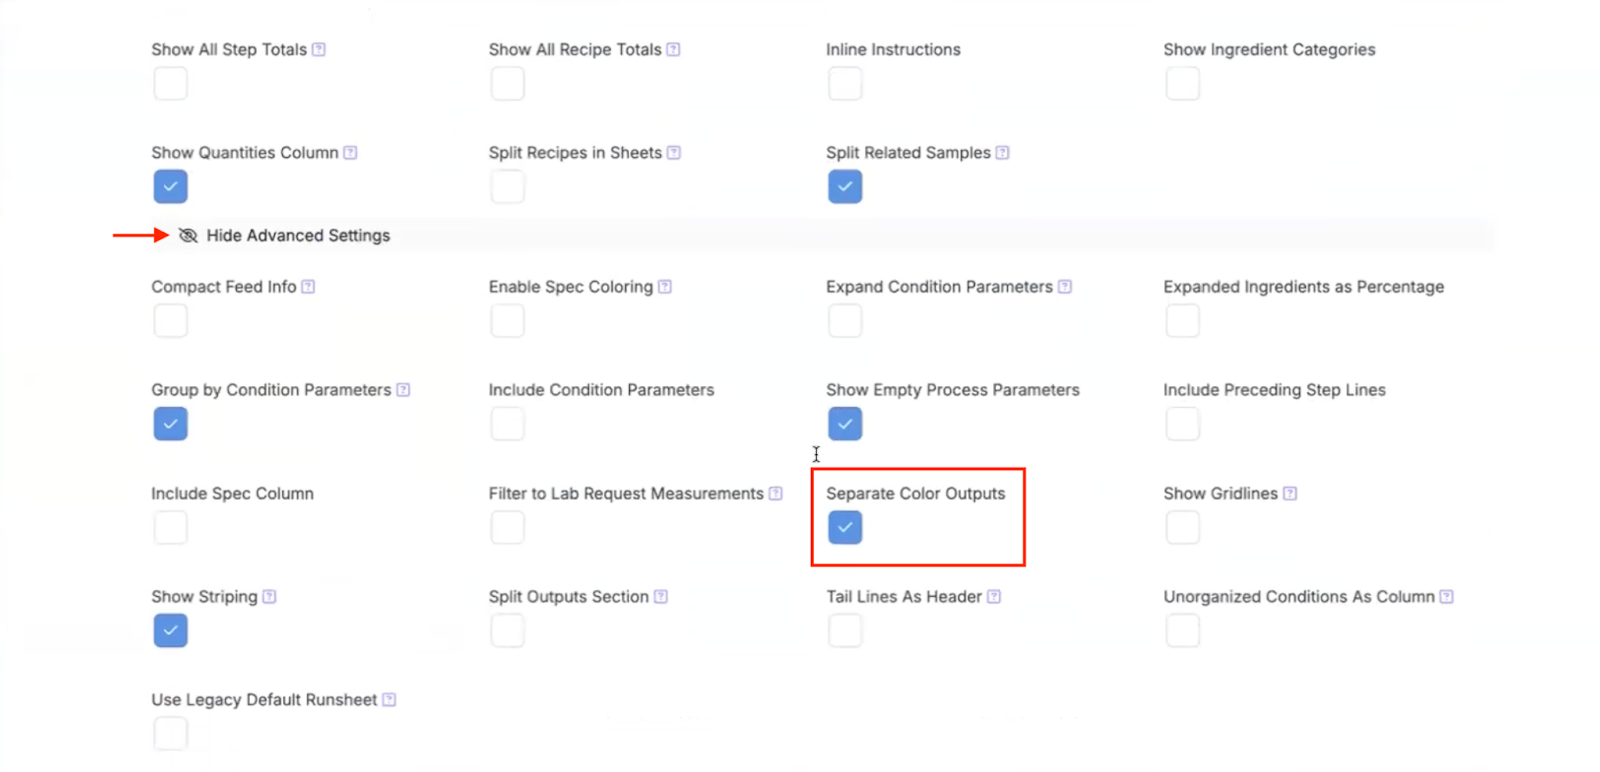
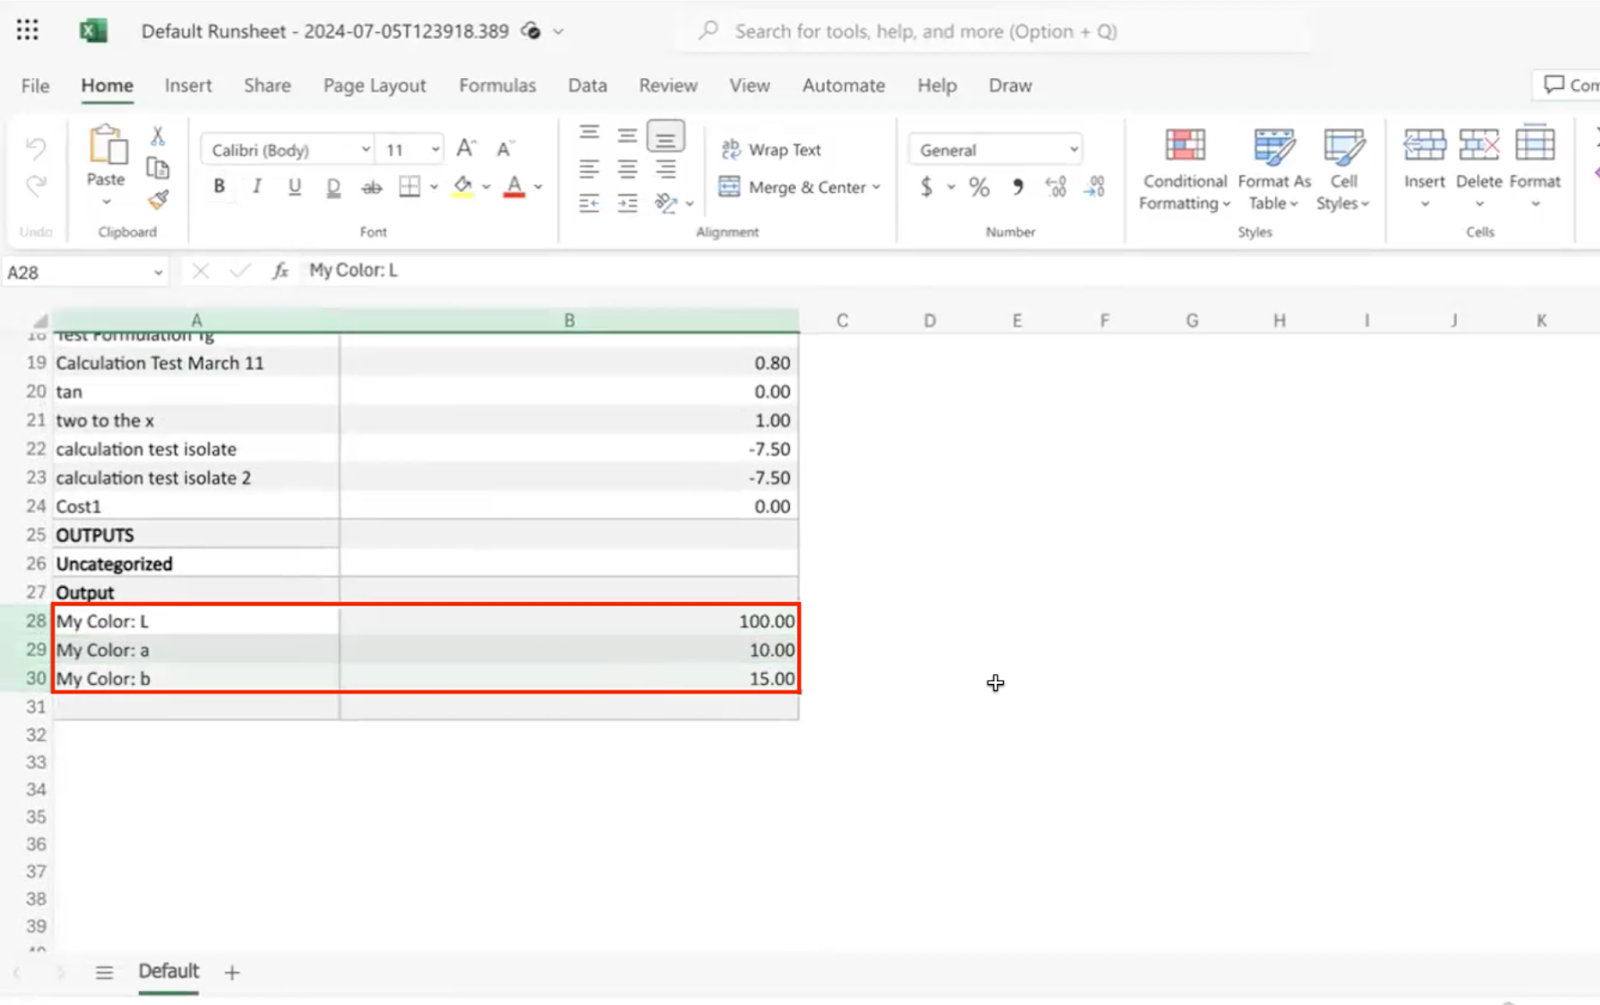
Separate Color Outputs in Runsheets
Uncountable has introduced a new configuration option in runsheets for LAB color outputs. When enabled, this feature stratifies LAB color values in the downloaded run sheet, providing users with detailed color management and reporting capabilities. This change enhances data accuracy in color-related analyses and experiments.
To use this feature, toggle on “Seperate Color Outputs” within the Advanced Settings section of the runsheet configuration.
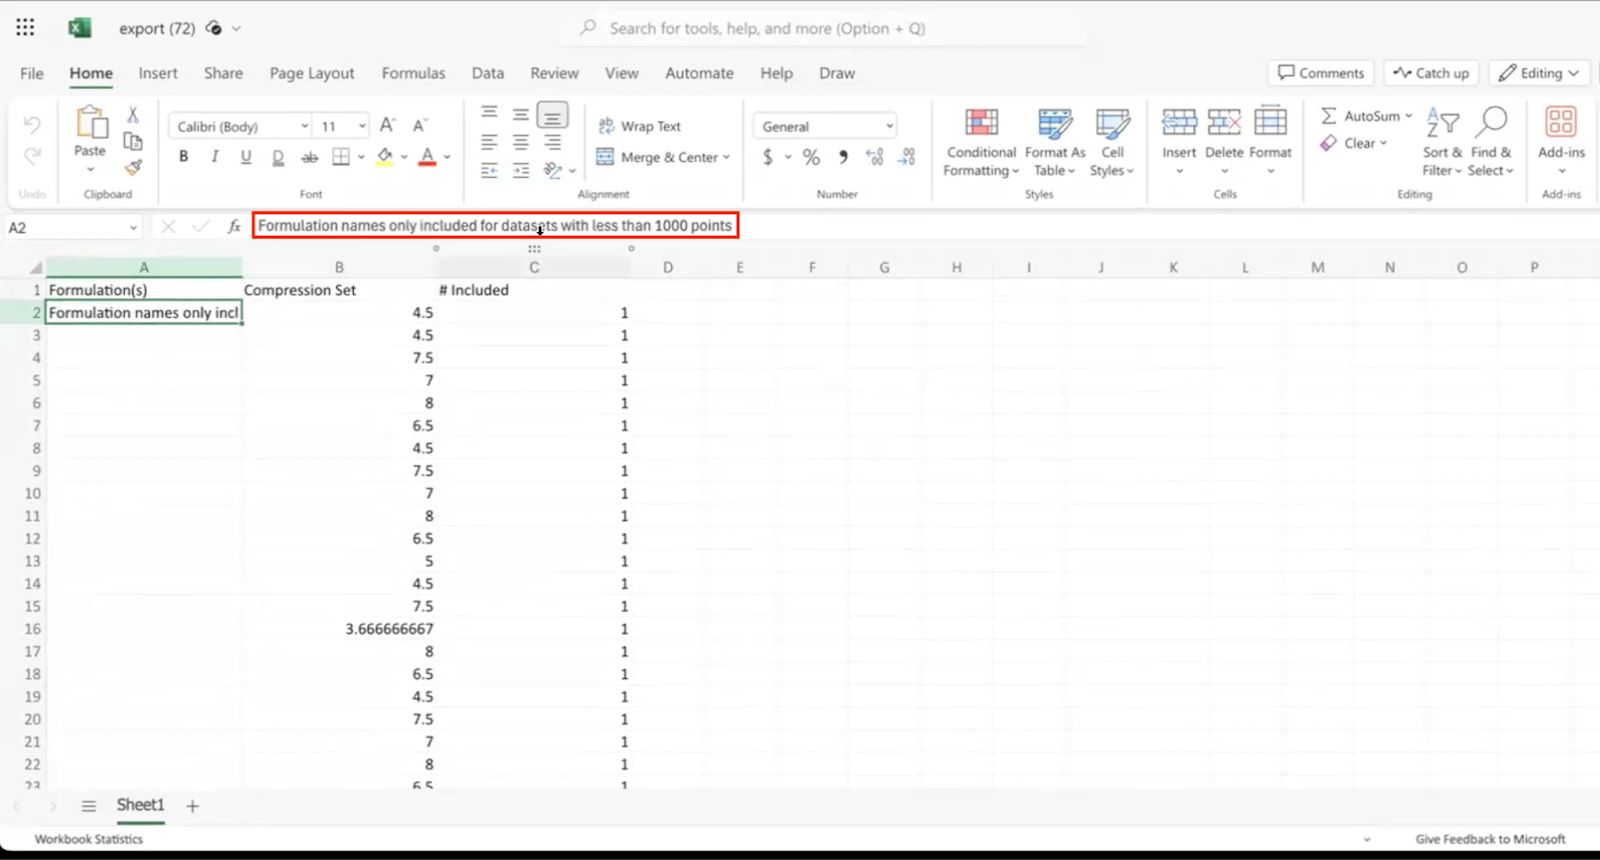
Recipe Names in Explore Data Export
In the Explore Data page, data exported to a runsheet now includes recipe names for each data point (up to a limit of 1,000 data points).
This inclusion improves data traceability and analysis by providing clear references to the recipes associated with each experimental data point in exported datasets.

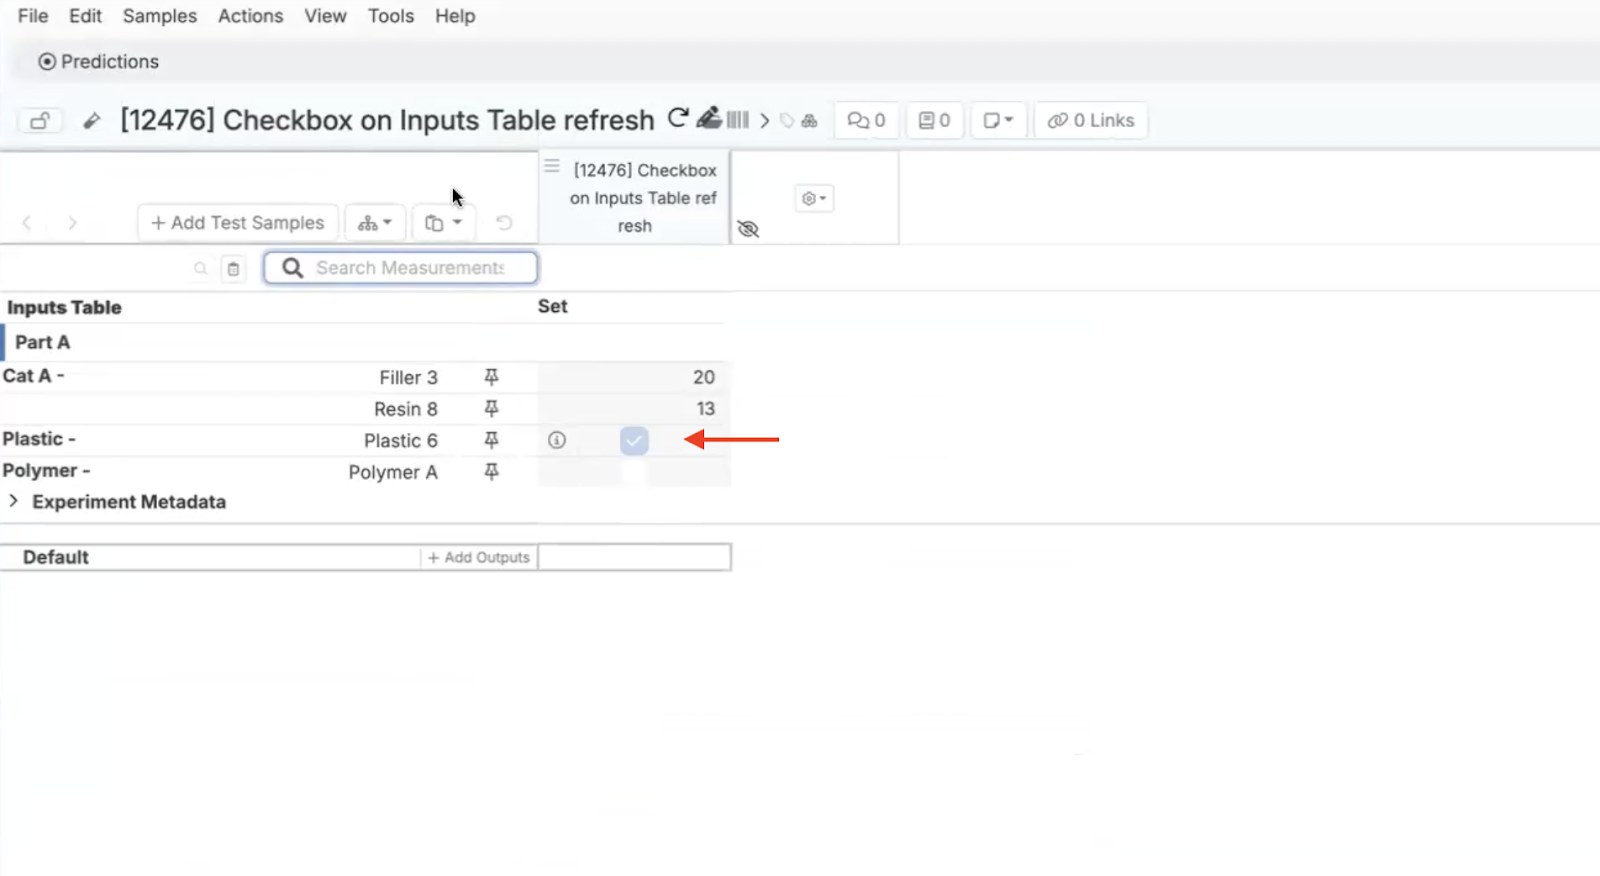
Read-Only Checkbox for Ingredient Behaviors
A new “Read-Only” checkbox has been added for ingredient behaviors on the Enter Recipe and Enter Measurements pages.
This feature provides users with enhanced control over ingredient settings during data entry, ensuring that specified behaviors remain unchanged and maintaining data integrity across experiments and recipes.

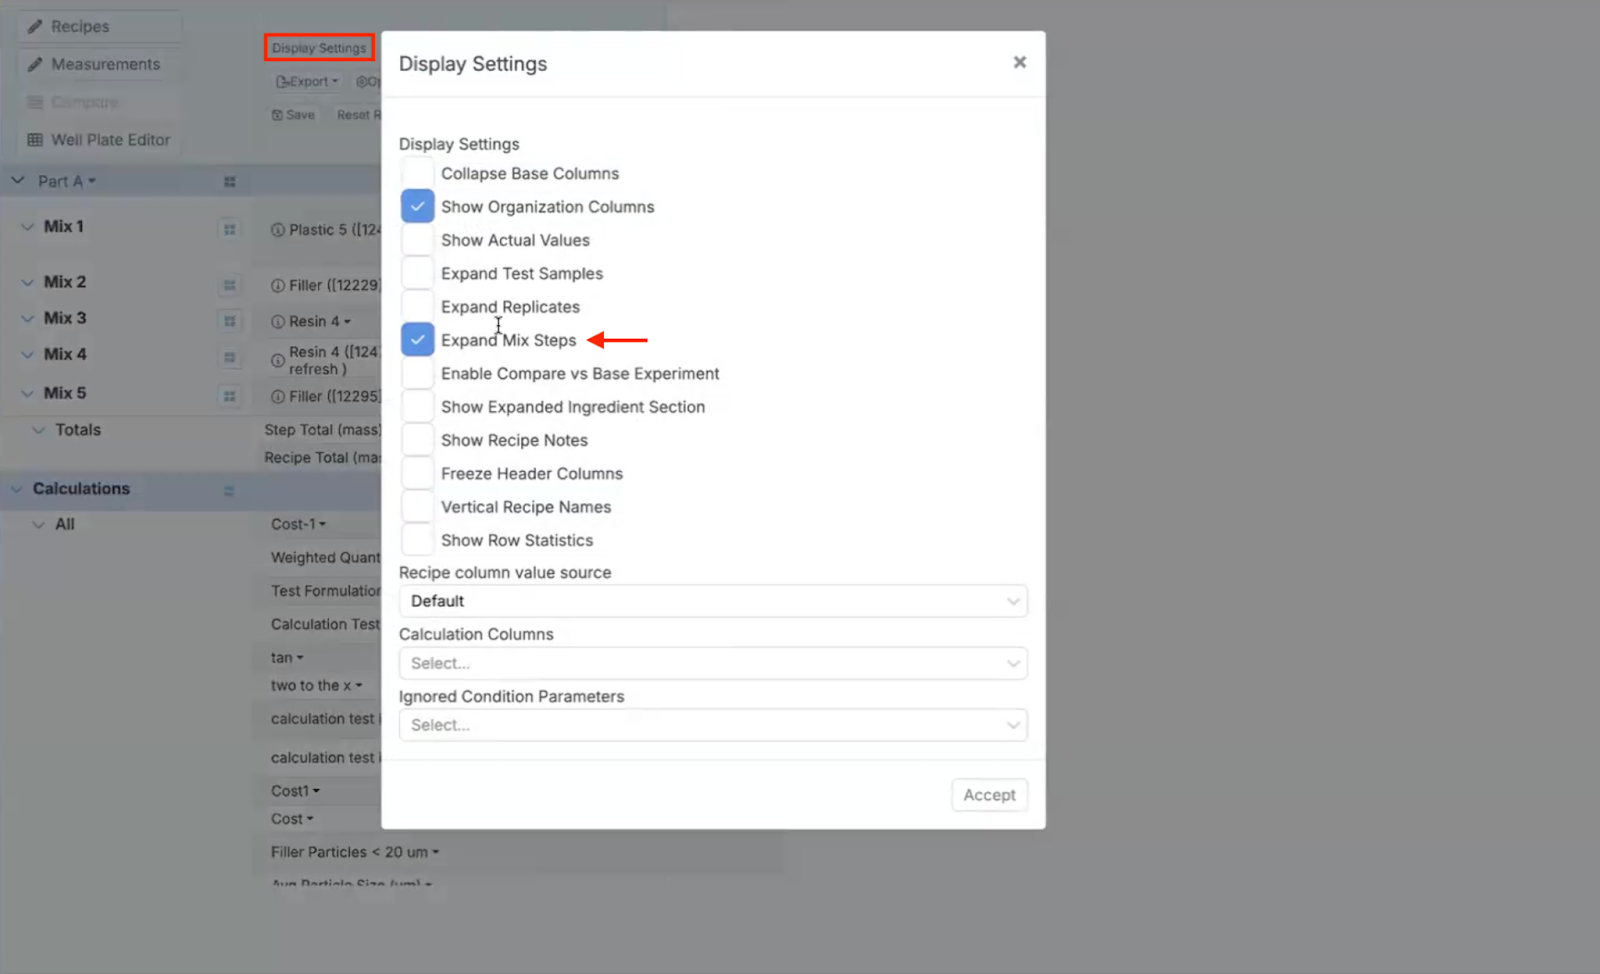
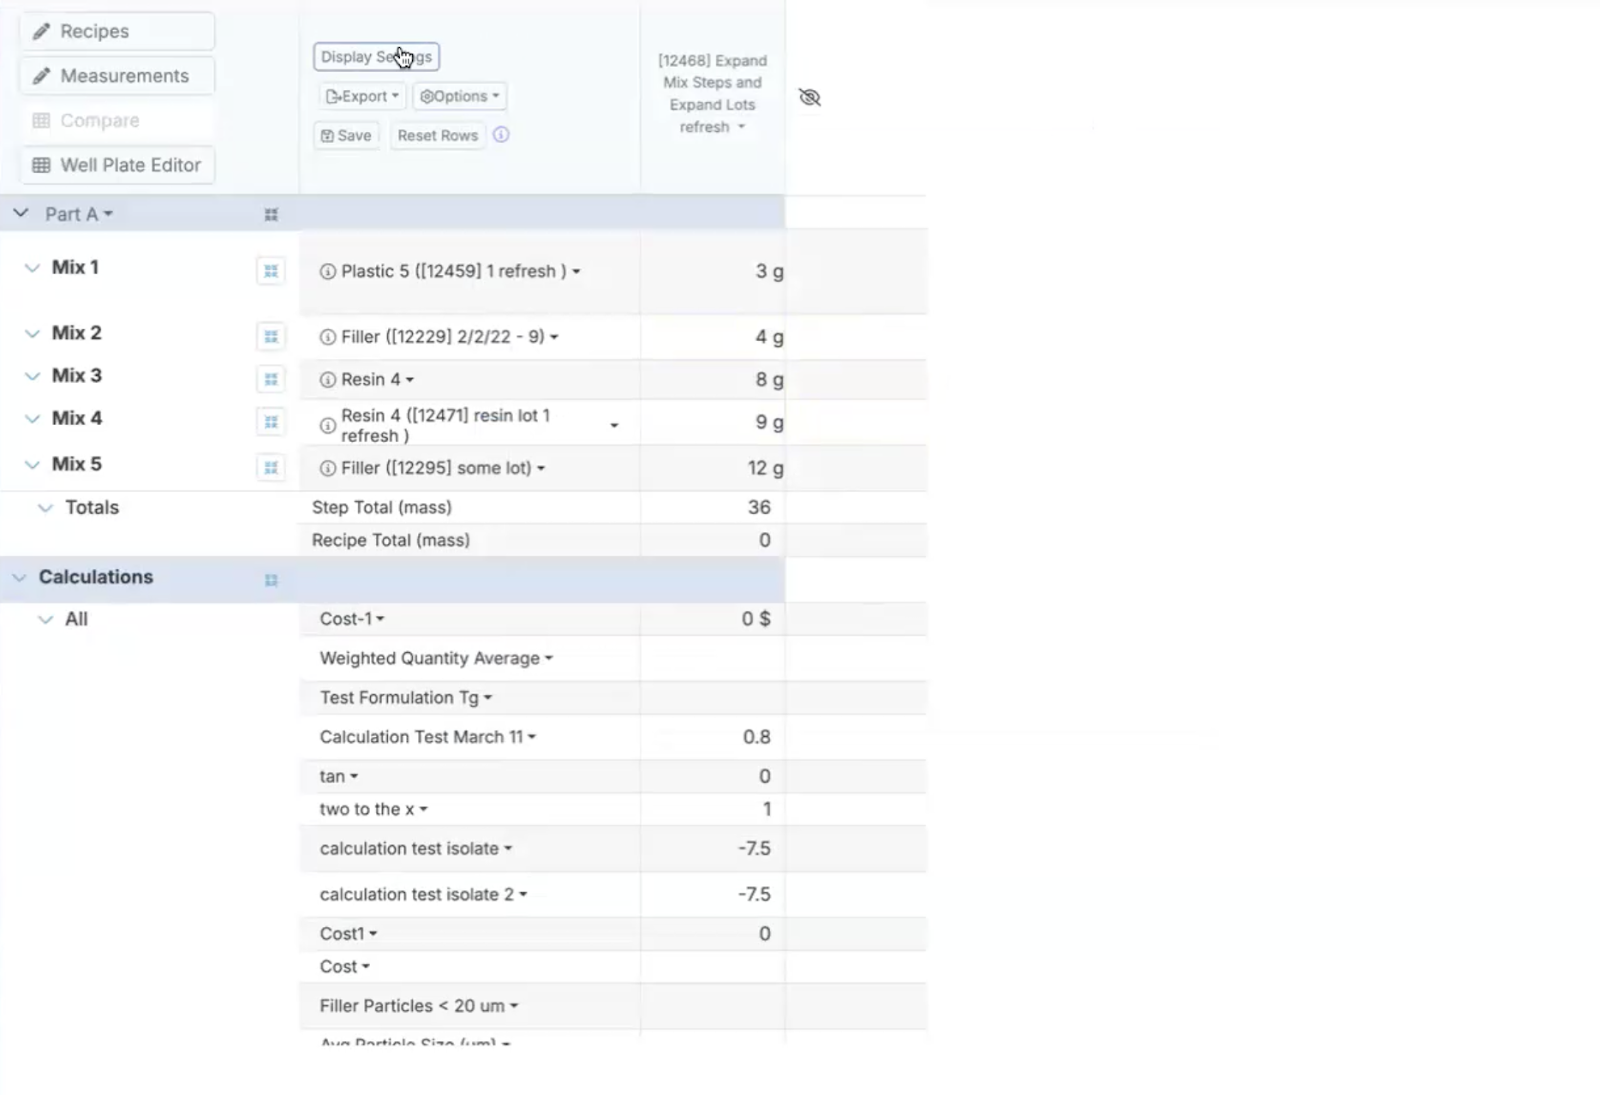
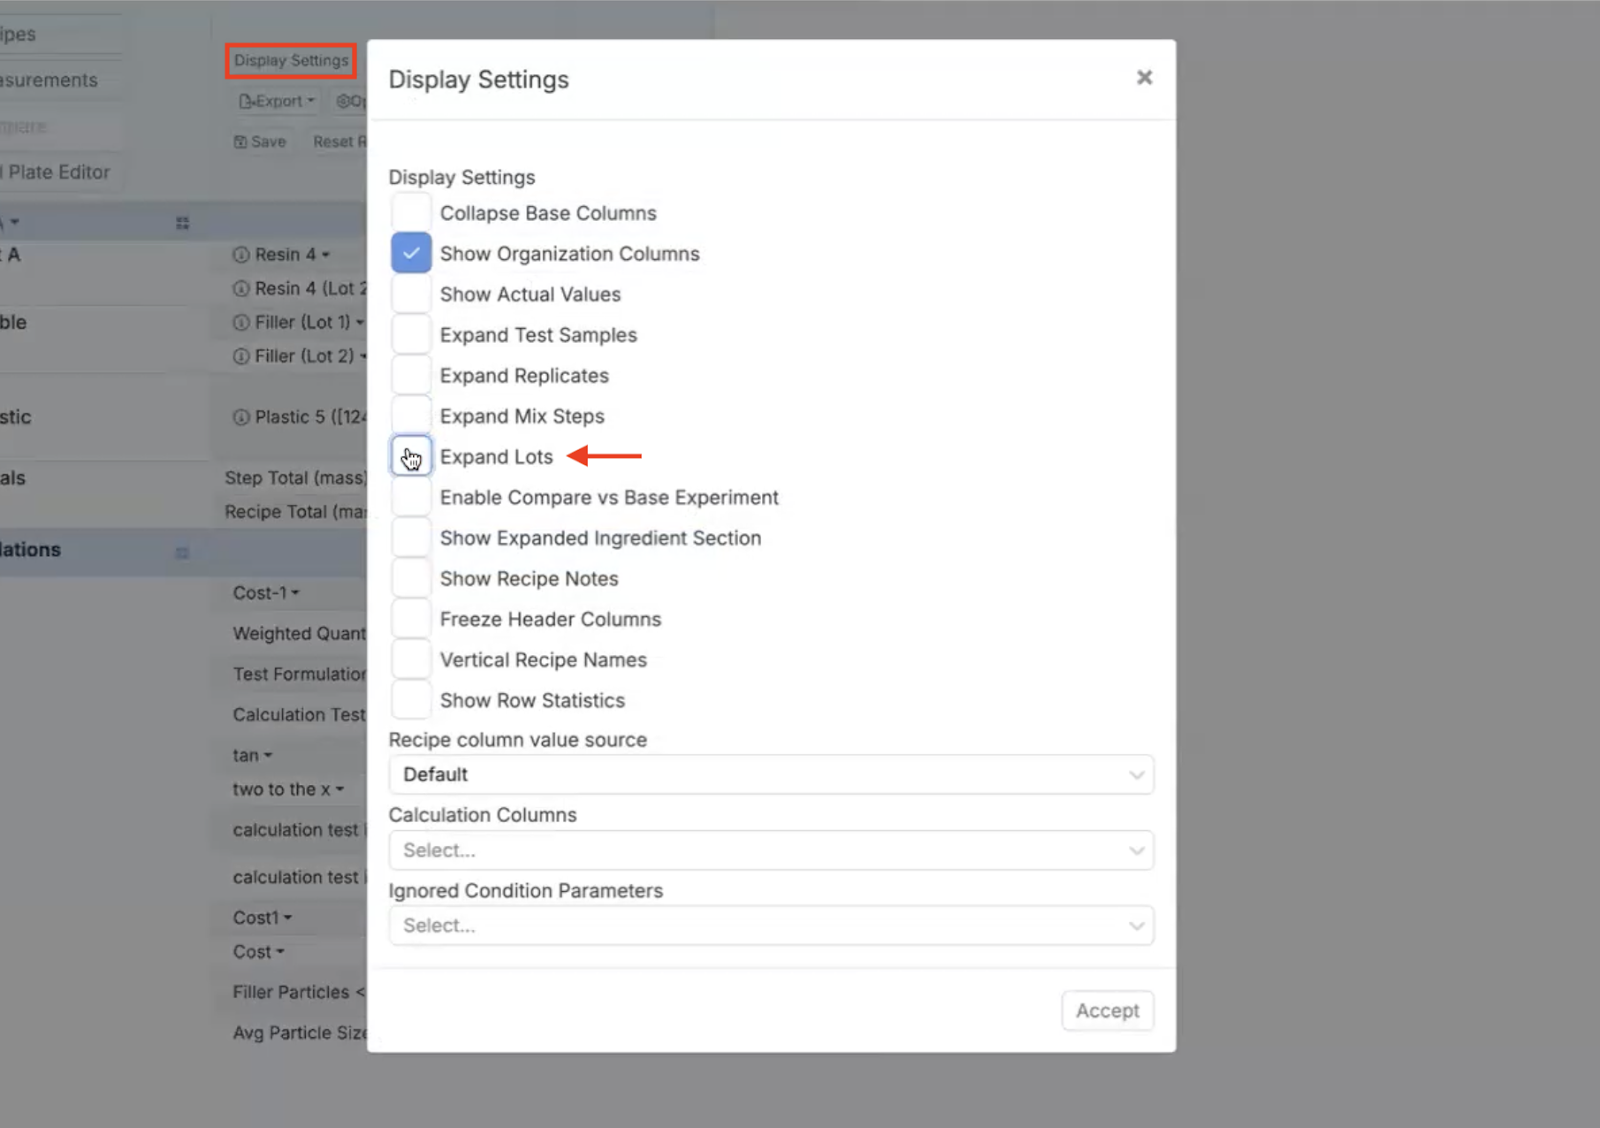
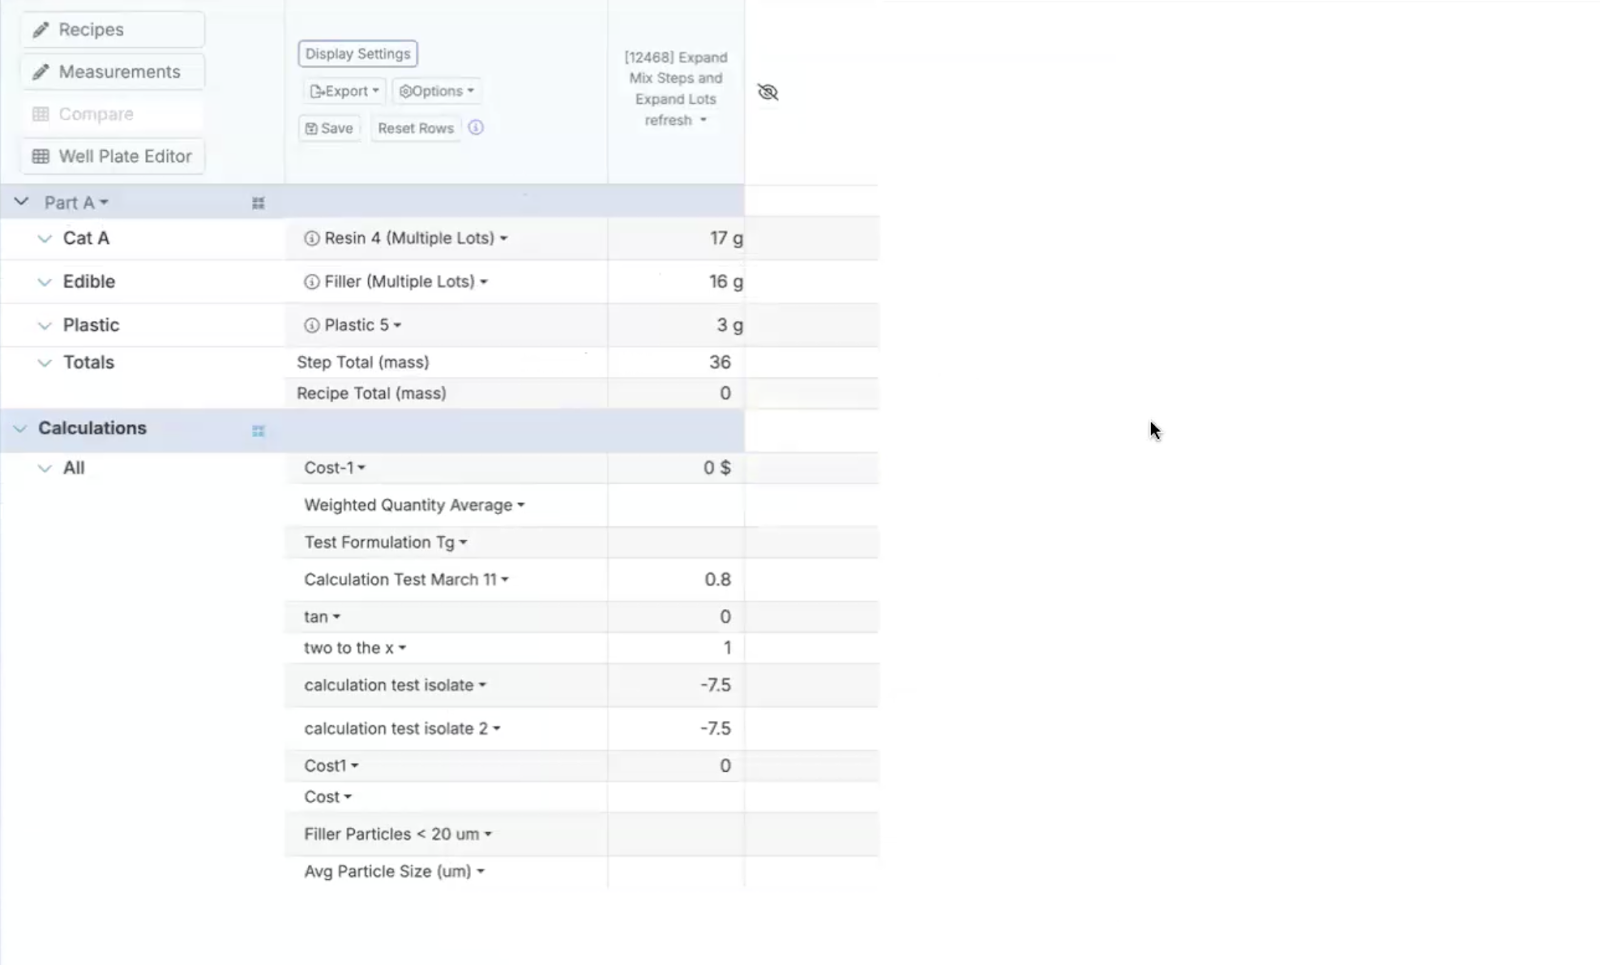
Display Settings for Mix Steps
The “Expand Mix Steps” feature has been relocated from Options to Display Settings. This change allows users to easily toggle the display of mix steps within experiments, enhancing usability and customization.
Additionally, a new “Expand Lots” functionality has been introduced to expand or collapse lot details based on user preferences, further improving usability and data presentation in experiment management.
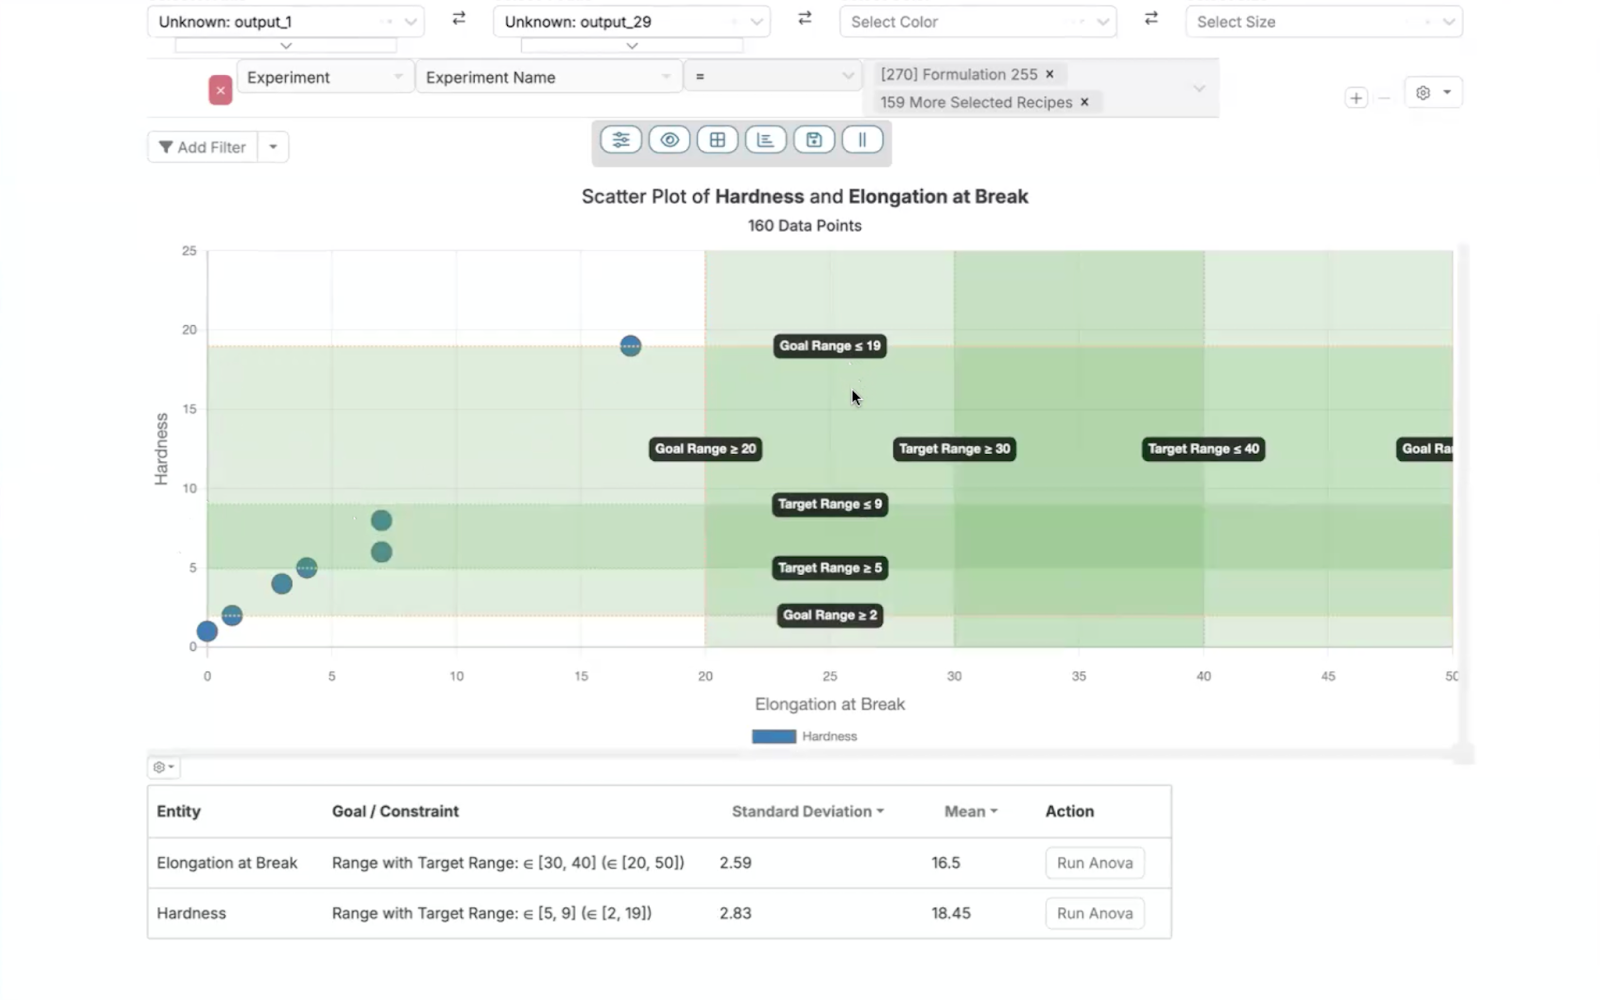
Goal and Target Regions Highlight in Visualize Page
A new feature on Uncountable’s Visualize page highlights goal and target regions for outputs. This enhancement visually indicates which experiments fall within specified goal ranges, improving data interpretation and decision-making in experimental analyses.
Note: Ongoing fixes are also underway to address issues with line visualization to ensure accurate and reliable data representation.
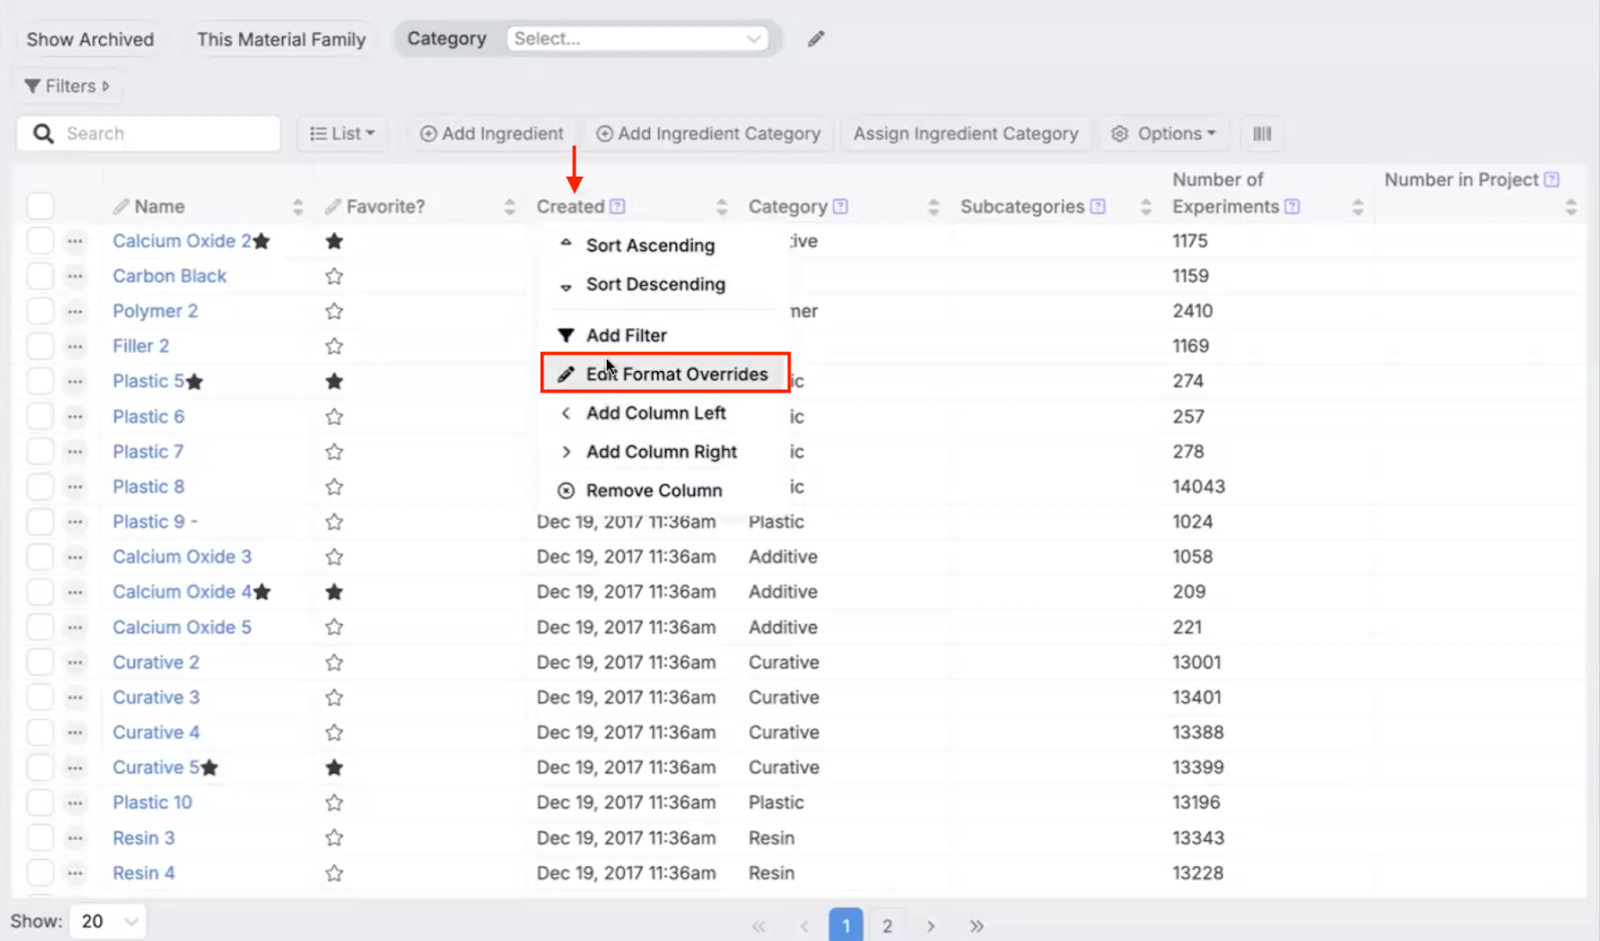
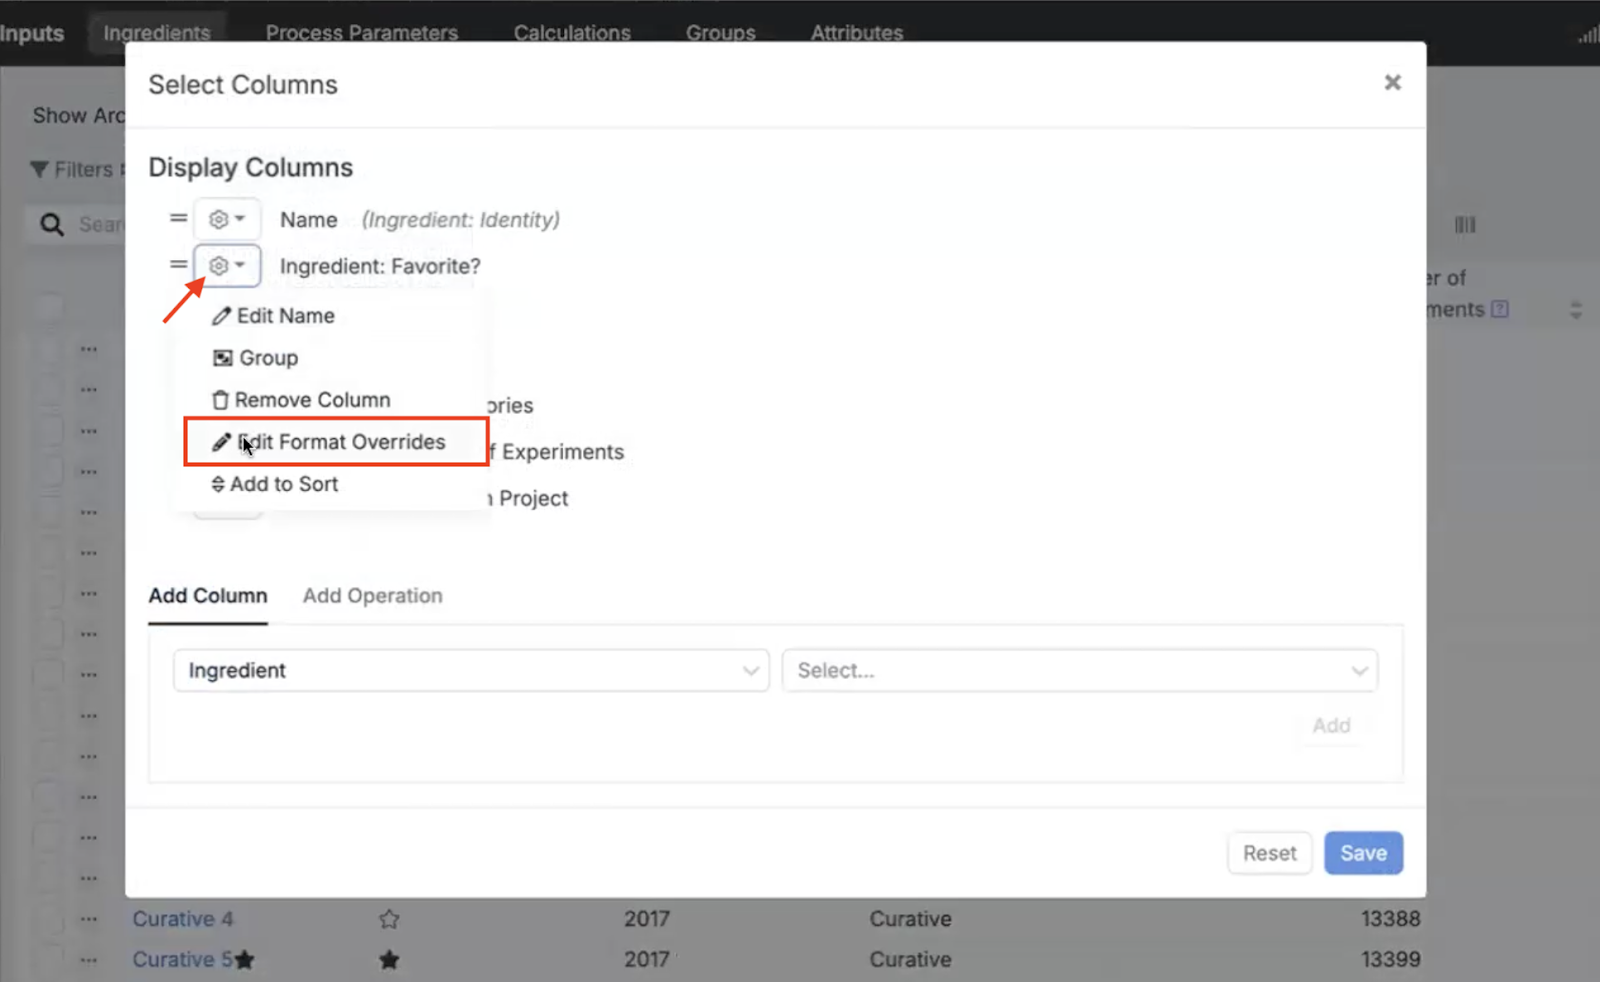
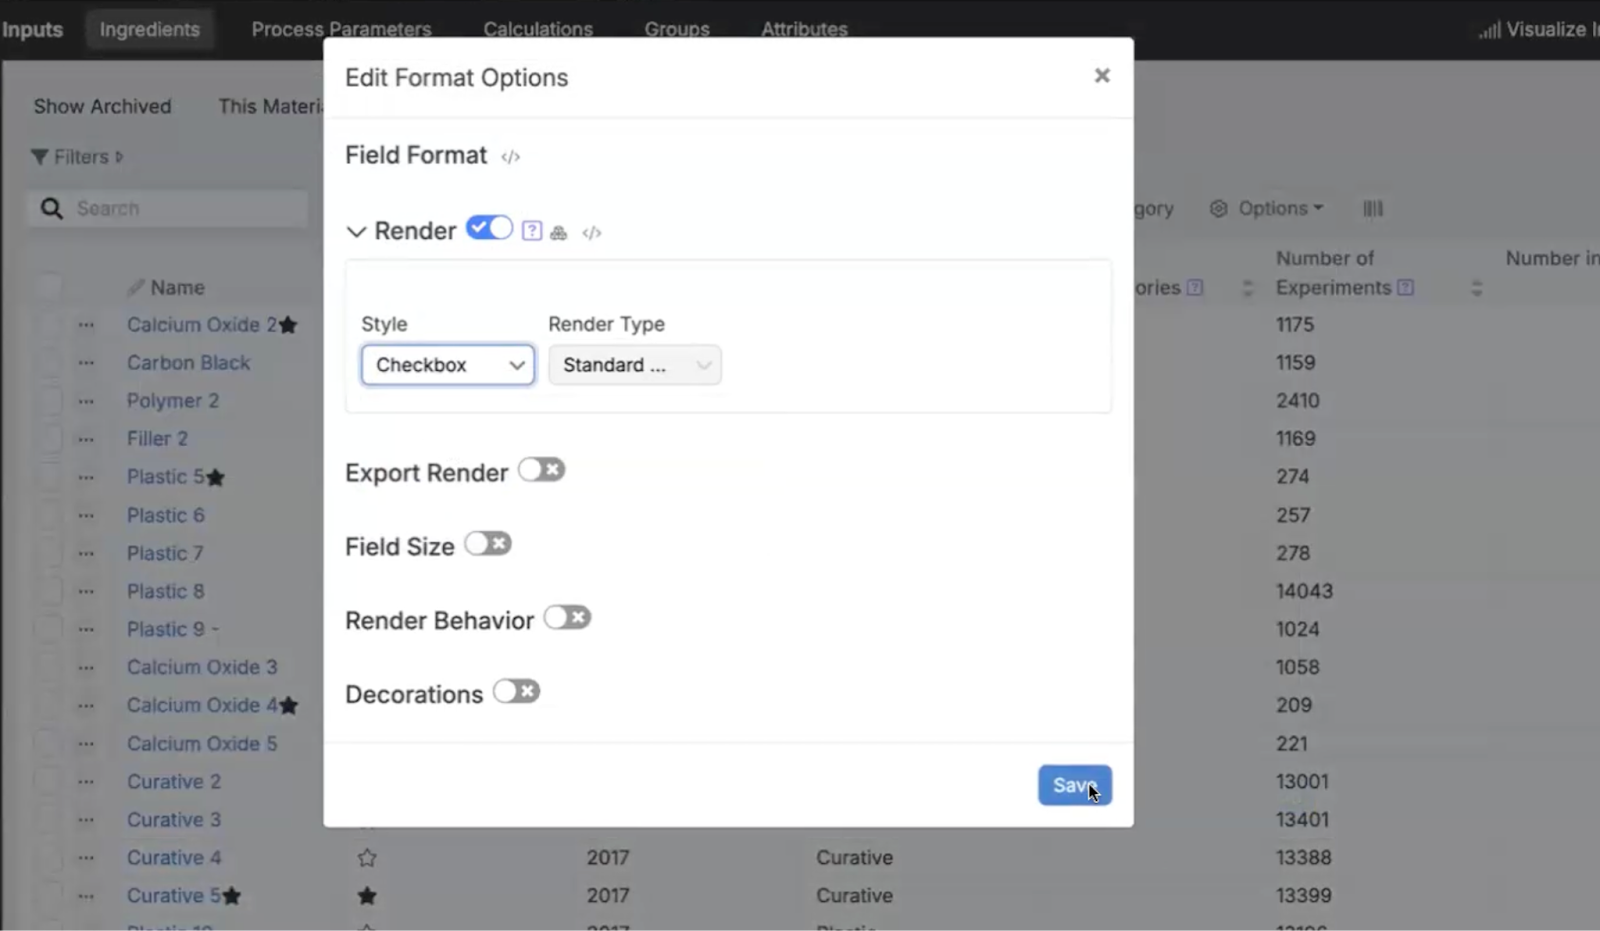
Edit Format Overrides per Column in Structured Listings
Uncountable users can now customize format overrides per column in structured listings.
This feature empowers users to tailor data display settings, such as adjusting text formatting or changing data representations like checkboxes, based on specific analytical or reporting needs. It enhances flexibility in data visualization and improves usability in data interpretation.
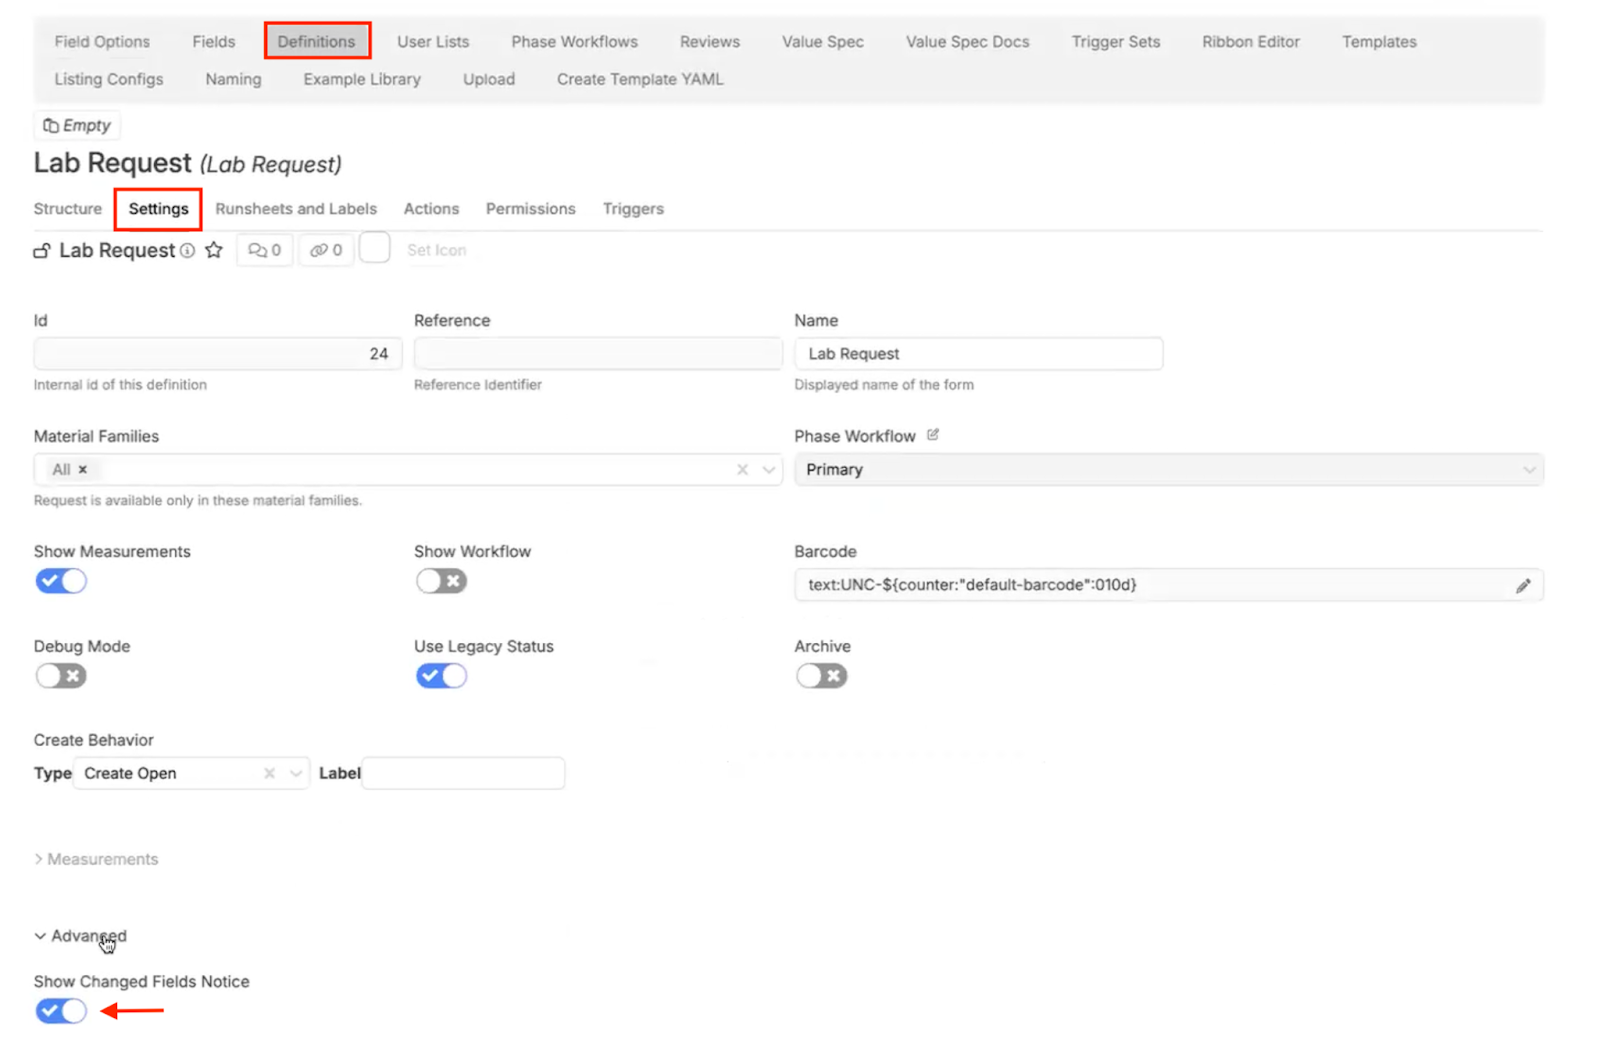
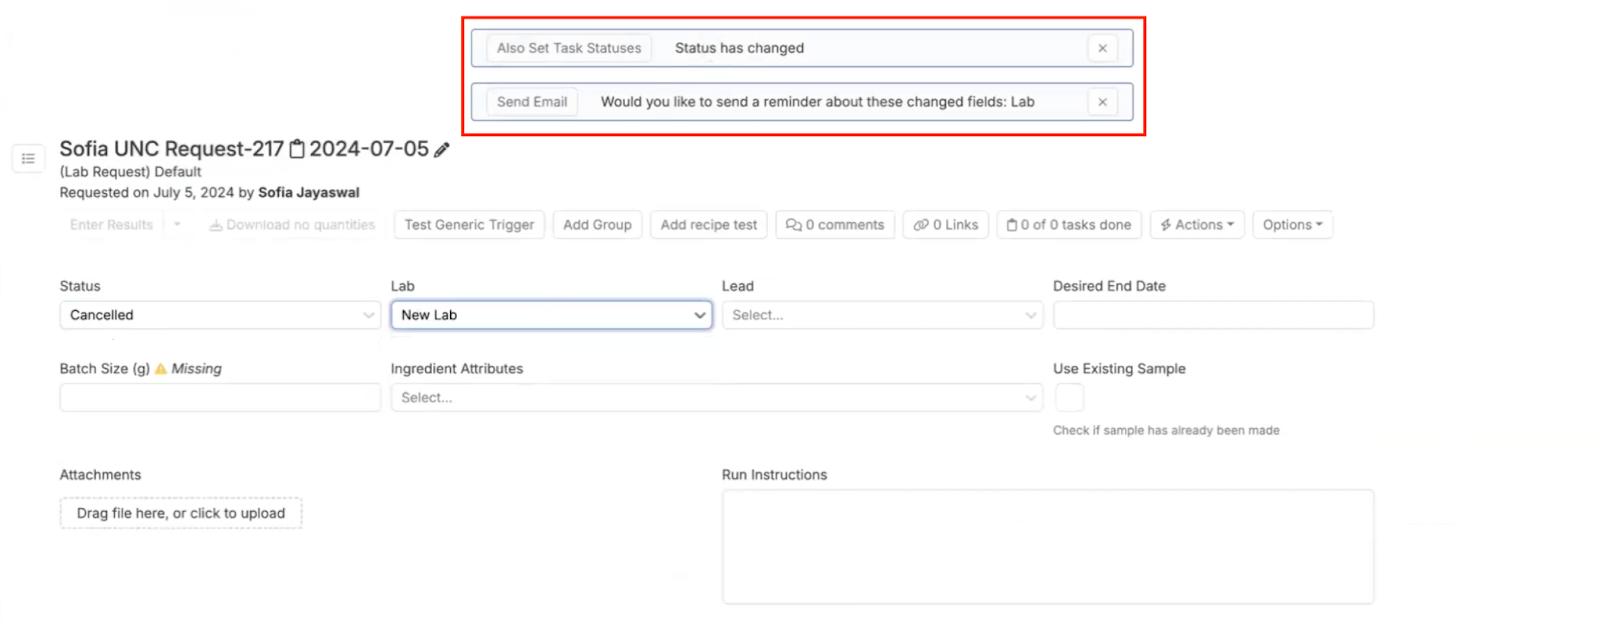
Toggle for Lab Request Field Change Notices
A toggle option has been introduced to control the display of notices when changing fields in lab requests.
Located within the Form Admin under the lab request definition advanced settings, this feature allows users to enable or disable notifications for changes in status or other fields, providing flexibility in managing updates and maintaining clarity in lab request workflows.
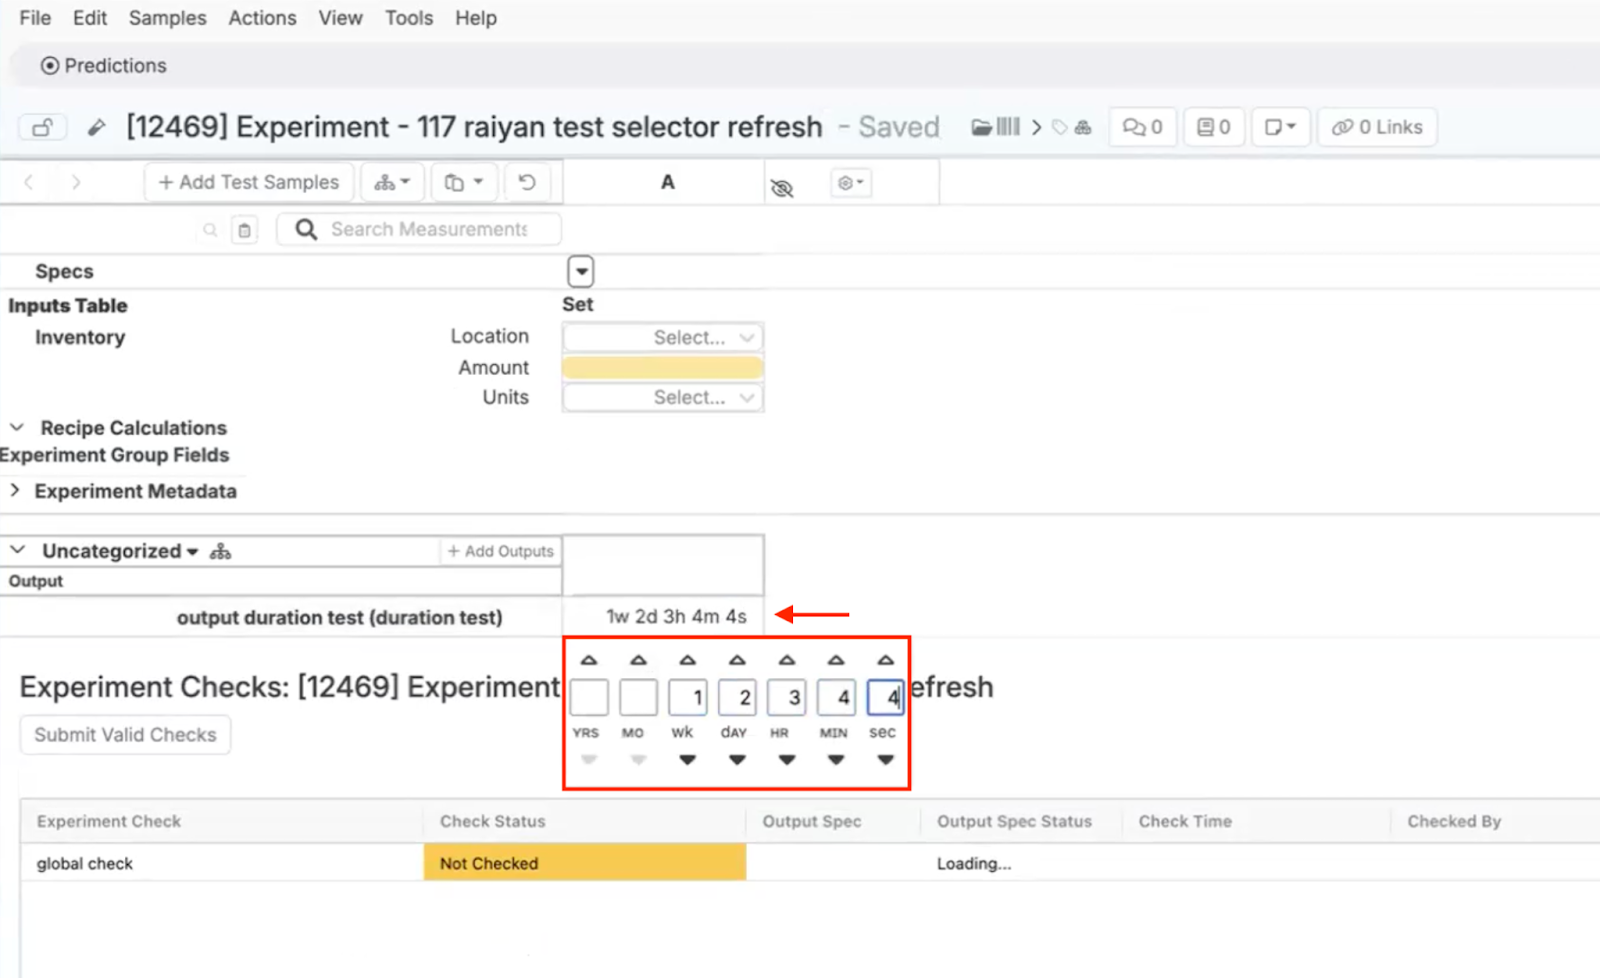
Time Unit Outputs Enhancement
Time unit outputs have been improved to display in their appropriate time components (i.e. weeks, months) instead of just seconds.
This update simplifies the interpretation of durations formatted in various time units, making it easier for Uncountable users to understand and utilize time-related data within the platform.
6/21/24
Paired Output for Annotation Display
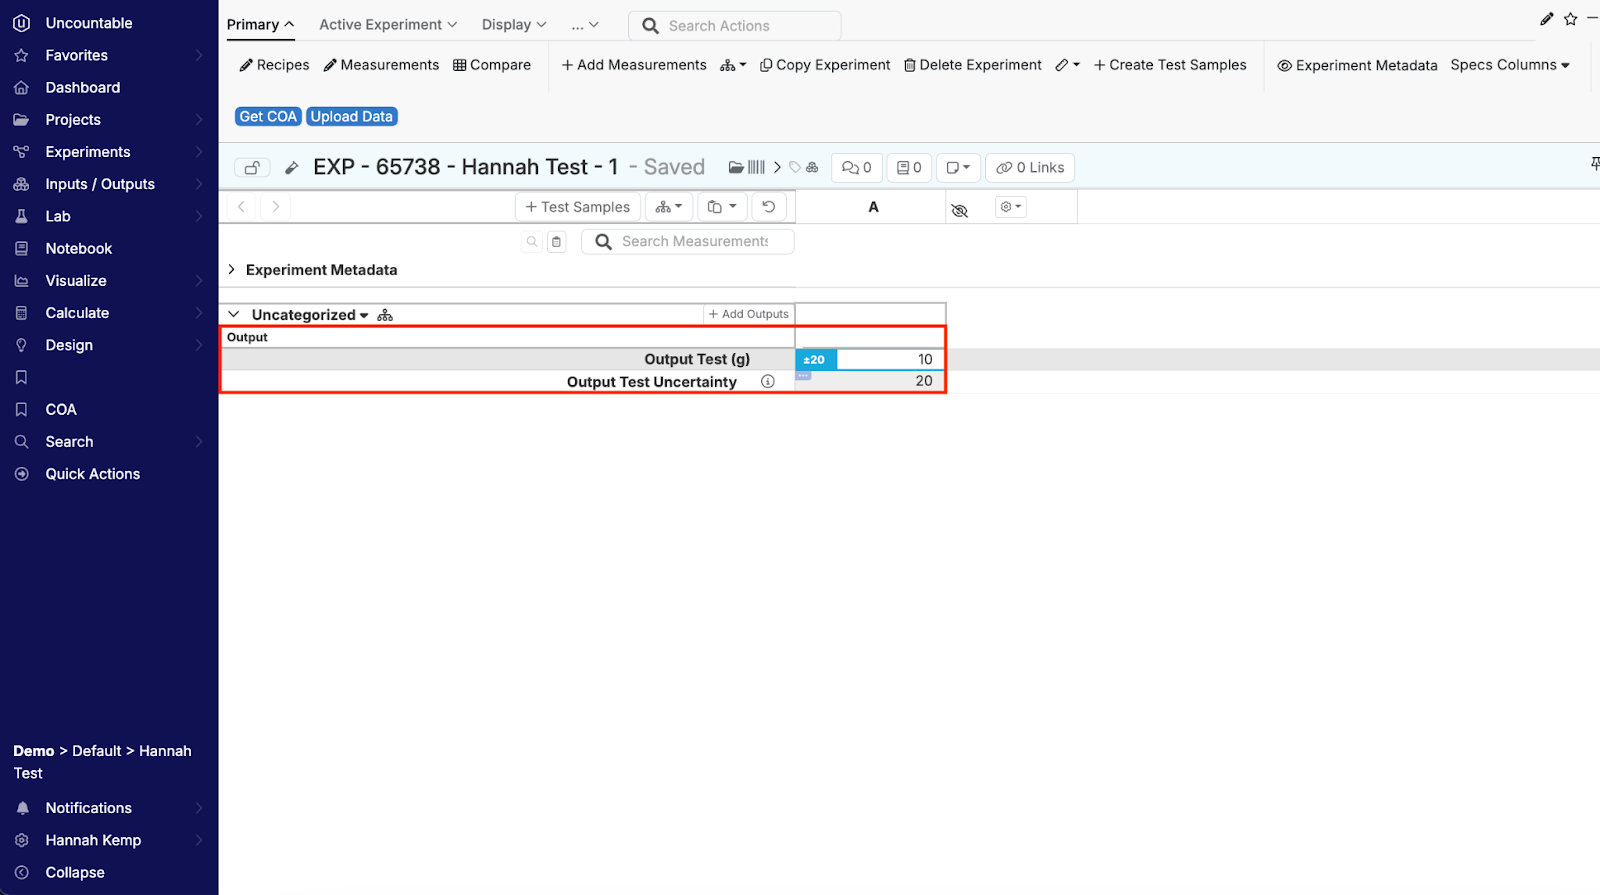
A new feature on the Uncountable platform enables users to pair an output with an associated calculation, displaying the calculation as an annotation within the output’s cell. The primary use case for this new feature is managing uncertainty calculations, helping to keep the calculations functional and organized.
To set up a paired output, create two new outputs—one numeric (i.e. “Output Test”) and one calculation type (i.e. “Output Test Uncertainty”). Define the calculation using the numeric output as a component.
Then, navigate to the calculation settings page and add the numeric output as a Paired Output for Annotation Display under Advanced Settings.
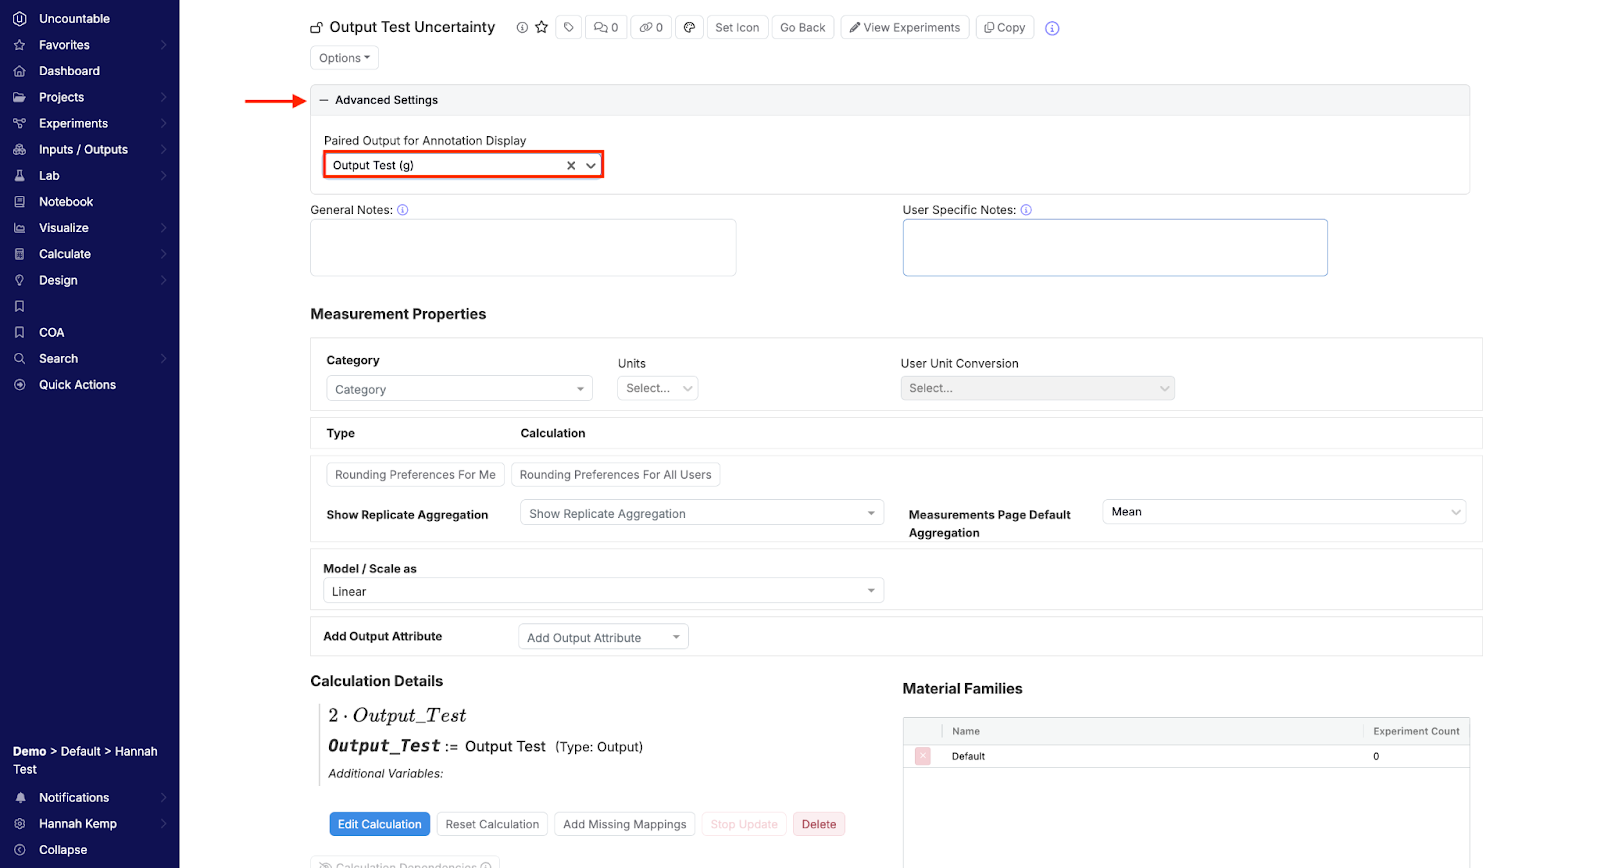
This pairing ensures that whenever an output value is entered, the associated calculation is automatically displayed, simplifying data management and enhancing clarity.
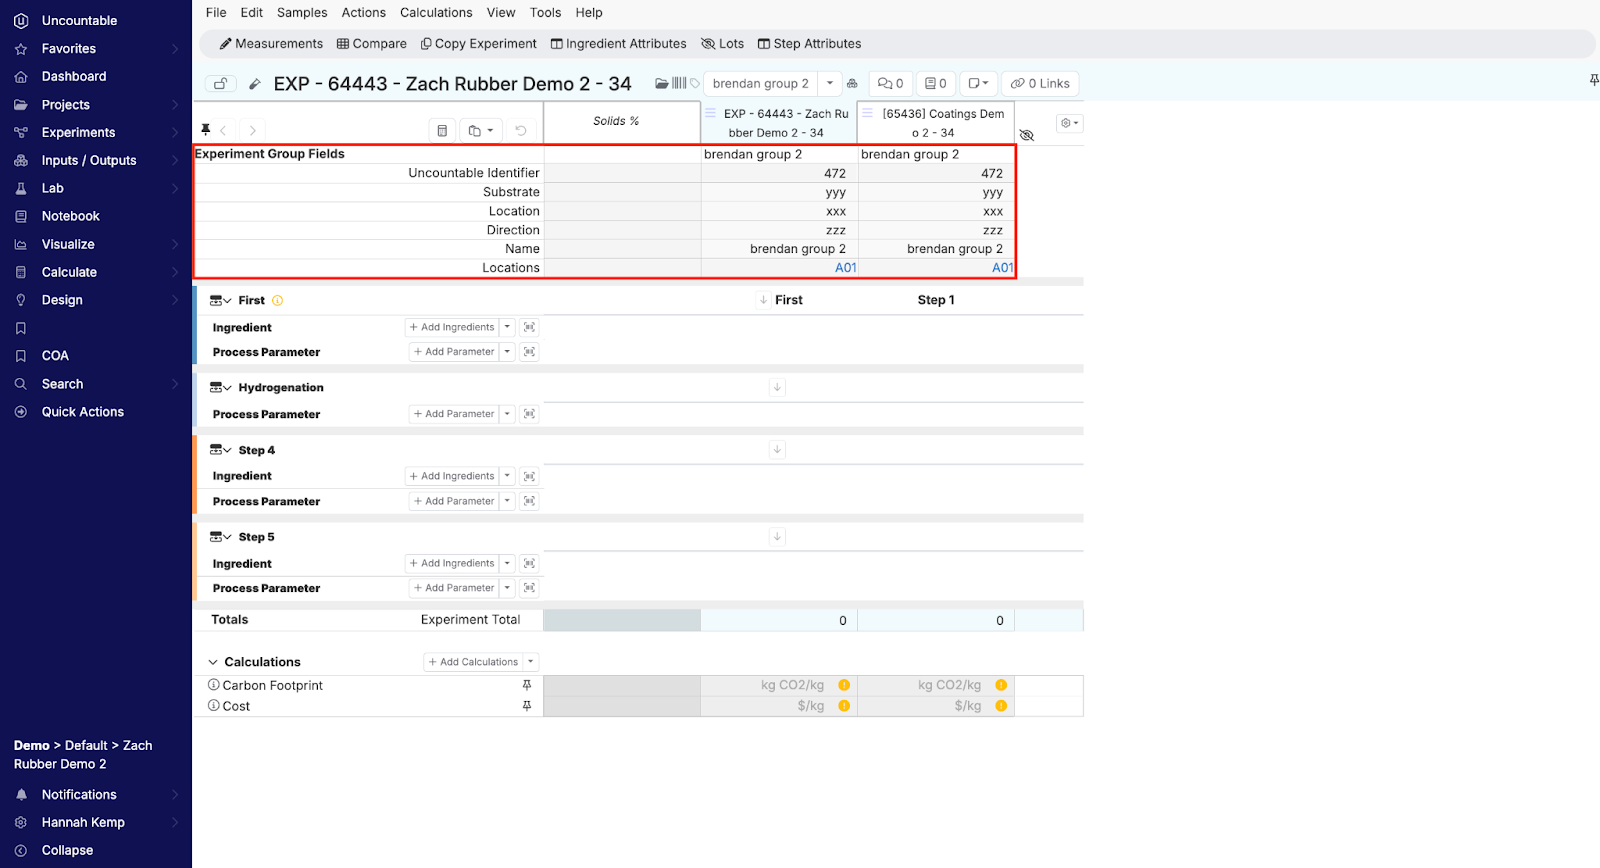
Enhanced Experiment Group Features
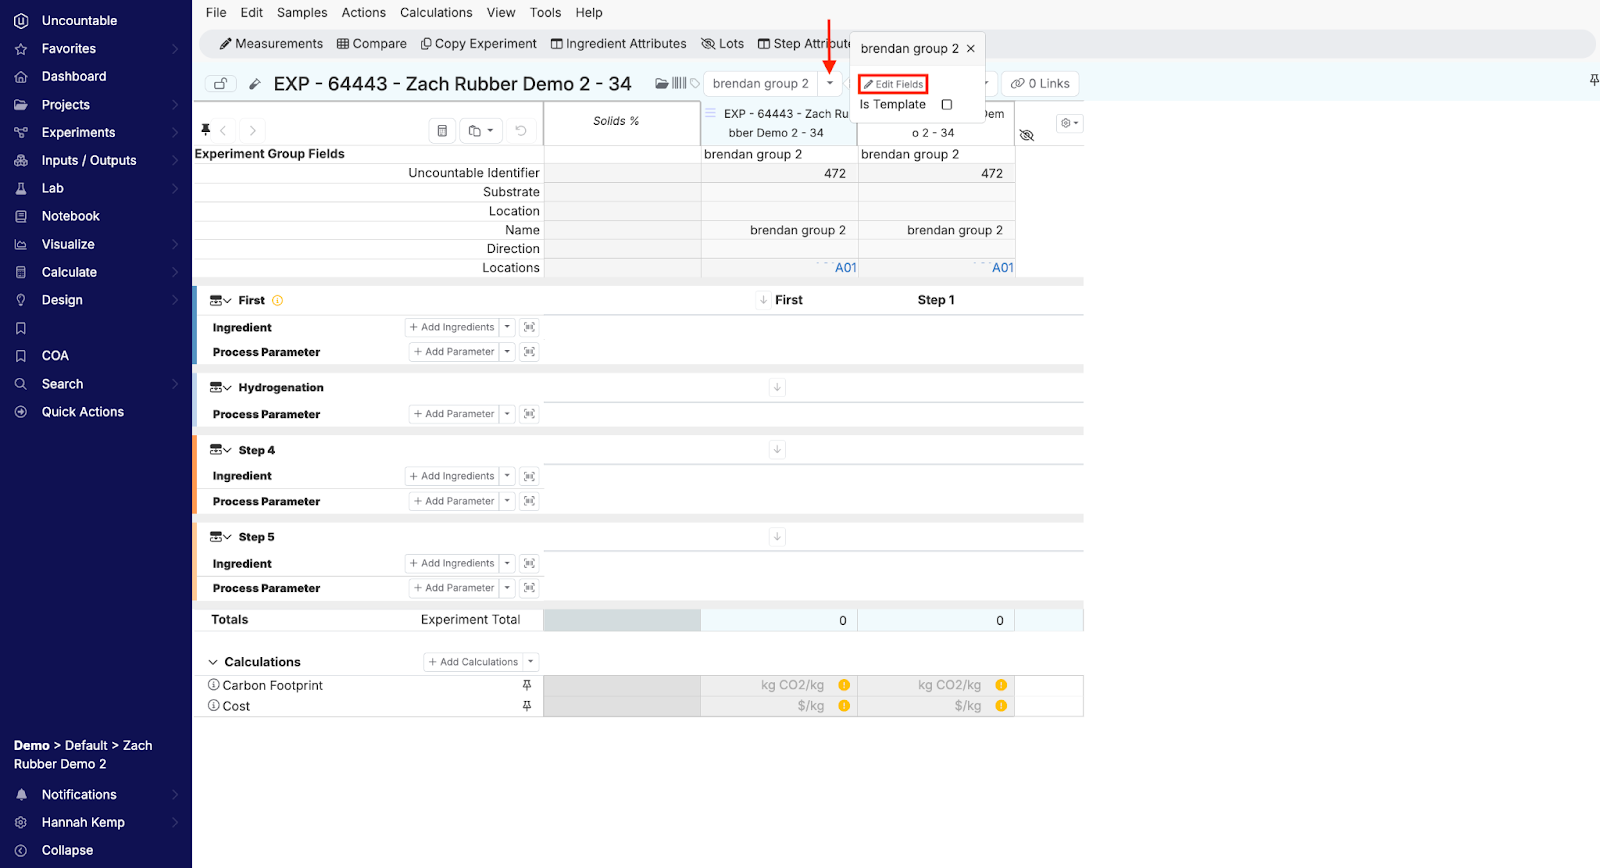
Easily organize and manage experiment data with Uncountable’s new feature which allows users to add experiment group fields, such as metadata and location, as new rows on Enter pages.
Group metadata can be added as experiment group fields from the Enter page or from the Experiment Dashboard. From the dashboard, locate the experimental group and hover the mouse over the “View Recipes”. Select “Edit Fields” to open the Modify Group Fields modal, in which you can define metadata such as location, substrate, and direction.
Note: To add new fields (other than location, substrate, and direction) you need to go into the experiment group definition on the form admin page and add them there

To access the Modify Group Fields modal from the Enter page, locate the experiment group name at the top of the page. Hover the mouse over the experiment group name and select “Edit Fields”.

Additionally, adding the experiment group as inventory enables the user to link location data. Navigate to the inventory page, click “+ Add Inventory”, and add the experiment group and location.
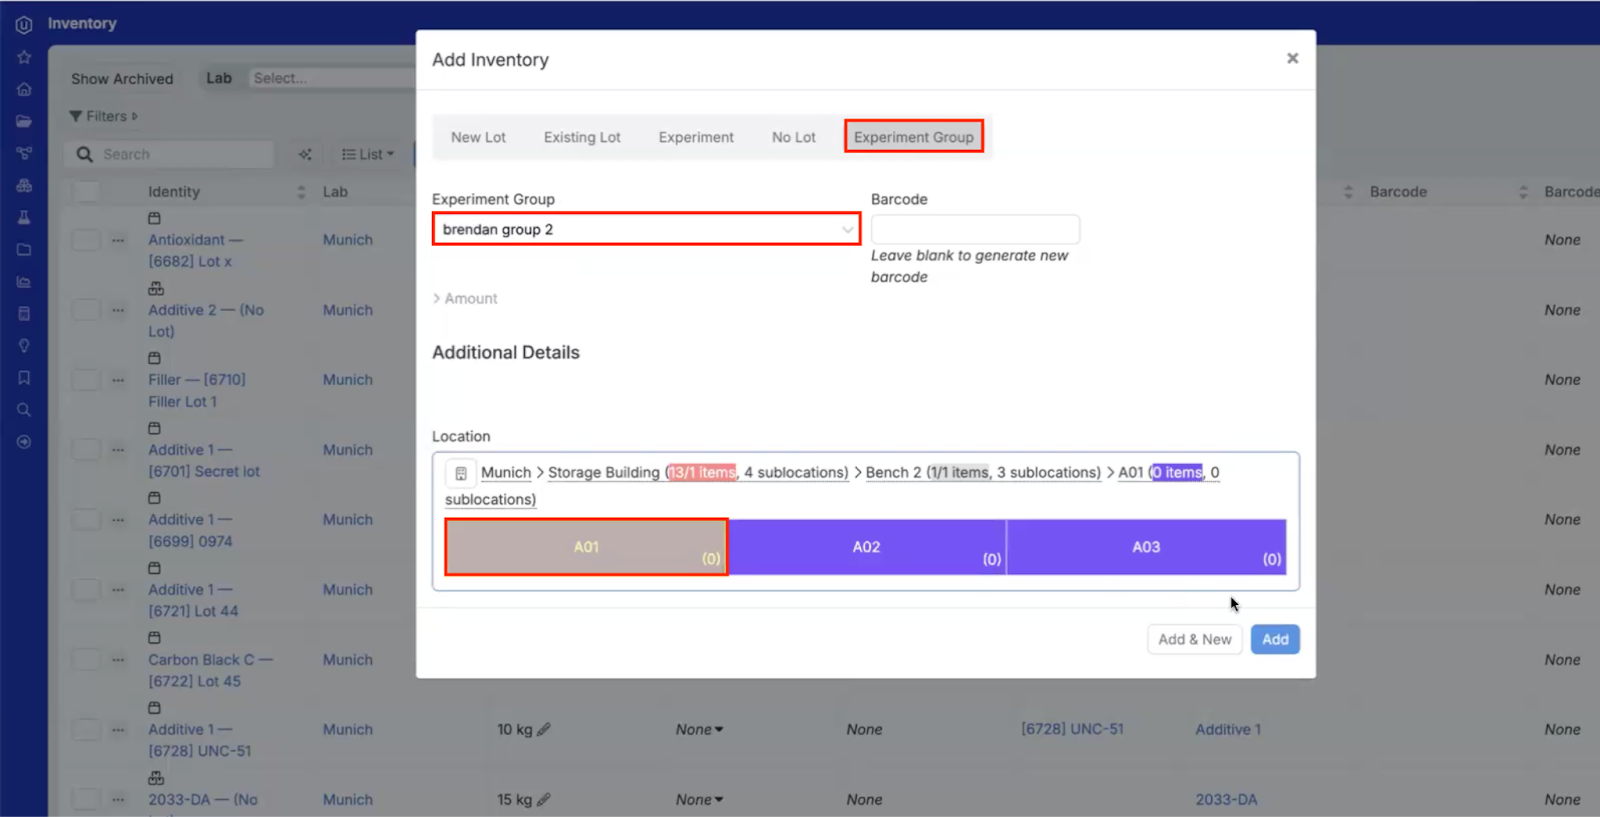
Returning to the Enter page, experiment group metadata, including location will appear as rows within the Experiment Group Fields section. Presently, all fields will be displayed when values are non-zero.
Clicking the location hyperlink will also bring you to the location page, where you can view information such as sublocations and inventory.
New Method for Creating Inventory Limits
Streamline inventory management with Uncountable’s new feature which allows users to set custom inventory limits using structured listing configurations.
This update enables users to limit beyond simple ingredients. Creating and using a structured listing configuration allows users to limit by category, quantity threshold, or a set of filters. Filter on criteria such as metadata, inputs, outputs, or ingredient attributes to increase overall limit customization.
Add structured listing configuration as an inventory limit by selecting the “Filters” tab. Once the limit is created, it appears in the listing config column, where it can be renamed or edited.
With the new update, the Current Inventory column will refresh automatically every six hours. However, users also have the ability to manually refresh an ingredient’s current inventory by clicking the “…” icon and selecting “Refresh Current Inventory”.


Editing Metadata Within the Well Plate Editor
Streamline your workflow with the ability to edit metadata directly within the Well Plate Editor in Uncountable.
Click the Value Editor in the top toolbar to modify numeric, categorical, and text-type metadata associated with well plates. For efficient updates across multiple entries, utilize the Edit Bulk option for bulk edits.
This update simplifies metadata management, allowing users to make quick and comprehensive adjustments directly within their workflow.

Bulk Refresh of Recipe Names
A new bulk refresh feature enables Uncountable users to simultaneously update all recipe names should there be a custom naming convention in place. Previously, users had to manually refresh each recipe name individually after changing a template.
Now users can use the Search Actions option at the top of the page to search for “Refresh All Recipe Names” to update all recipe names in the view to reflect the latest changes. This enhancement improves efficiency when managing recipes.

Runsheet Improvements
Several enhancements have been made to improve the organization of Uncountable runsheets.
- Split Related Samples Configuration: A new configuration option has been added for experiments with nested test samples. When this option is enabled, runsheets will now separate nested test samples based on their link paths.

- Grouped Runsheets: When downloading runsheets, samples are now grouped by their linked paths. Root recipes remain on the same level, and nested test samples with the same linked path are grouped together, providing a clearer and more organized structure.

Assigned Specs in Runsheets
Enhance your runsheet management with Uncountable’s new feature that allows users to display or hide assigned specifications in downloaded runsheets.
Through the display or assign specs settings, users can decide whether to always show or never show assigned specs. If set to “always show,” the assigned specs will appear in the runsheet. If set to “never show,” the assigned specs will be omitted.
This update ensures consistency between the runsheet UI and the downloaded version, making it easier to manage and review specs.


Replicates Image Preview Added on Enter Measurements Page
An update to Uncountable’s UI adds an image preview for replicates displayed in rows on the Enter Measurements page.
Previously, when display settings were set to “Always Replicate Row”, the replicate display simply indicated “multiple”, but now it shows a more detailed view.
The improvement enhances the user interface, making it easier to visually identify and manage replicates while maintaining the same functionality as before.

Recipe-Enabled Calculations
A new concept of recipe-enabled calculations has been introduced on the Enter Recipe page.
Users can now manually set specific calculations to show for certain recipes by pressing “Add Calculations”.
These calculations will appear alongside project information and can be viewed by hovering over the info icon. The tooltip will indicate the reason for displaying the calculation, such as “for all projects,” providing clearer context and relevance.


Signature Block Notebook Cell Type
Add your digital signature directly into the Uncountable platform notebook by clicking the “+” icon and selecting “Signature Block”. Users will also receive a pin to verify their identity before the signature is added to a notebook.
This new feature enhances the integrity and security of your documentation, making it easier to manage and verify signed documents within the Uncountable platform.


6/7/24
Change to Ingredient Lot Naming Warning
Uncountable has refined its lot creation process to provide more specific warnings. When creating a new lot, a warning will appear if there is already a lot of the same name for that specific ingredient.
Previously, a warning was triggered if a new lot had the same name for any ingredient within the system. Now, it functions only as an ingredient specific check.

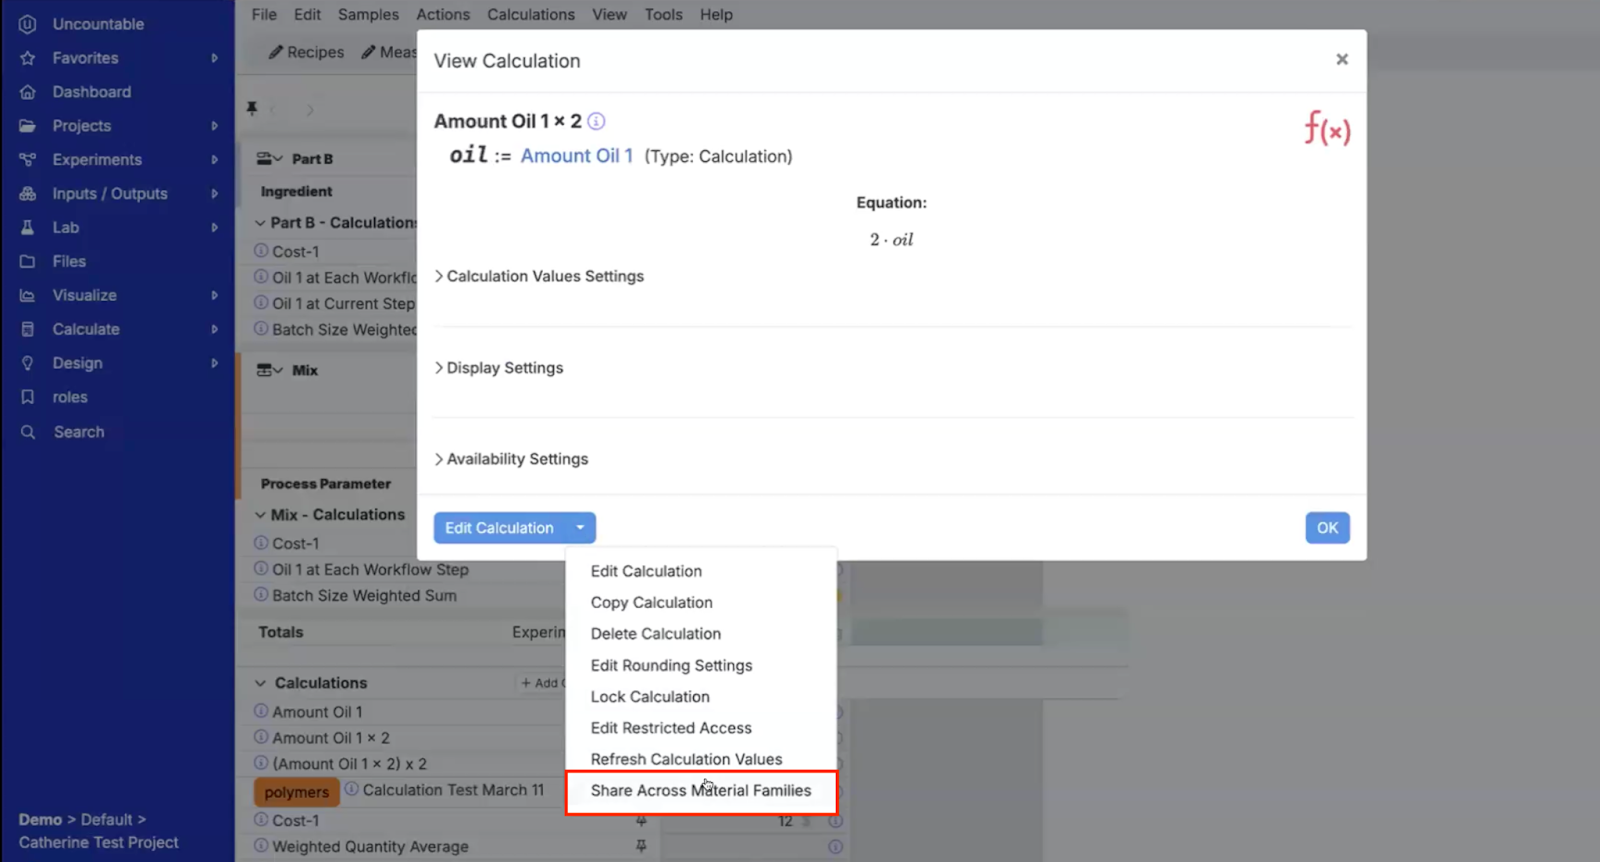
New Ability to Share Calculations Across Material Families
A recent update supports sharing calculations across material families directly from the Enter Recipe page.
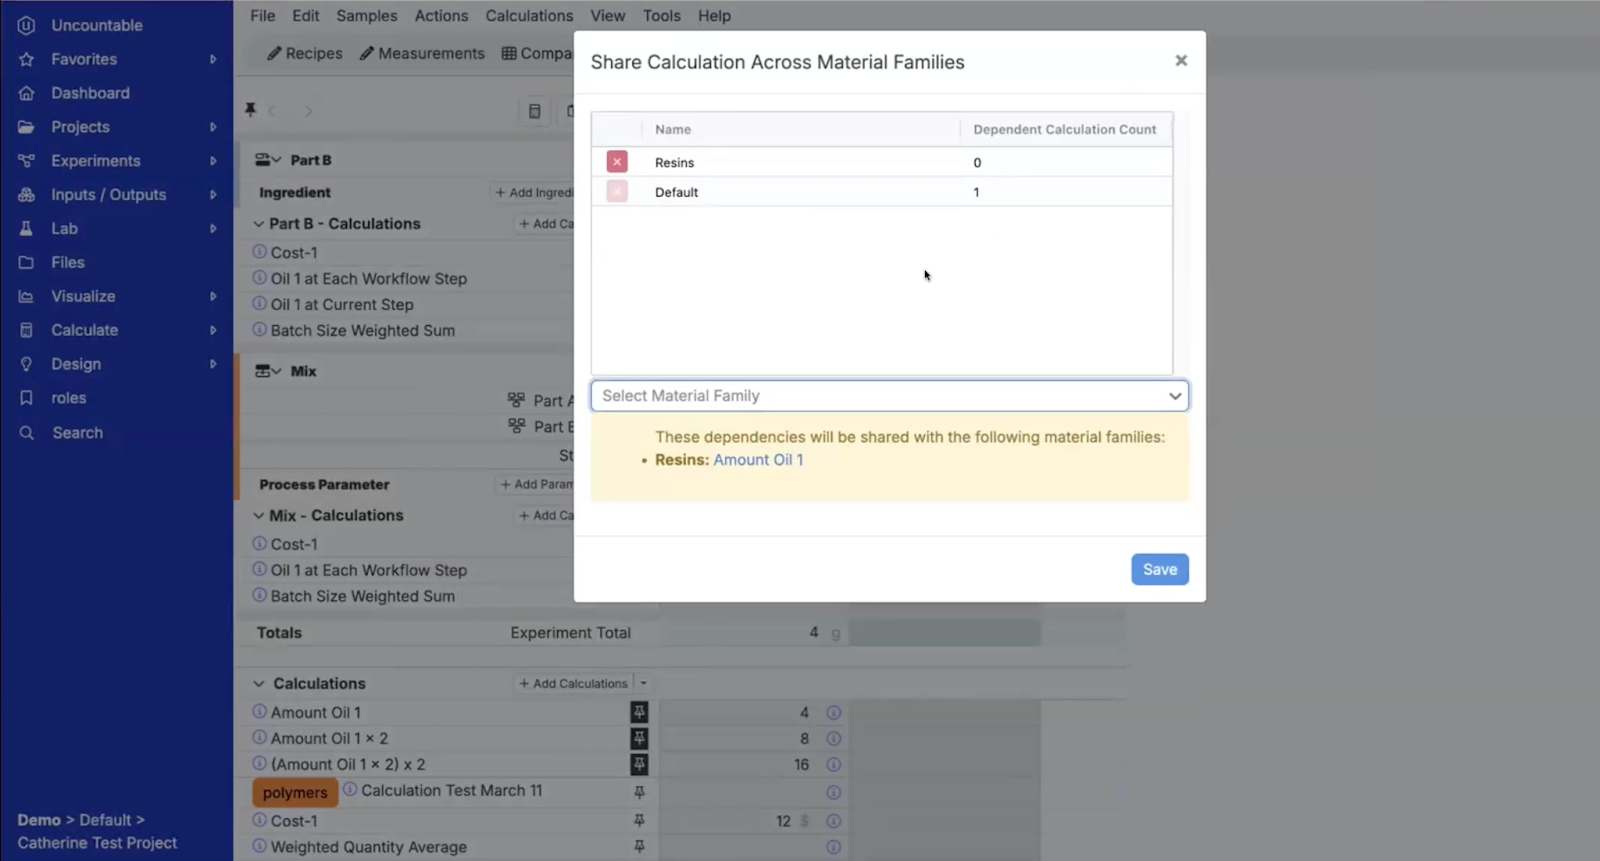
Share calculations by selecting “View Calculations” from the calculation’s dropdown menu. Open the Edit Calculations menu and select “Share Across Material Families”.
In this modal, users can select the material families with which to share the current calculation. Another helpful feature indicates the number of additional calculations within each material family that depend on the selected calculation.
Users have the option to remove calculations from material families, except those with existing dependencies.
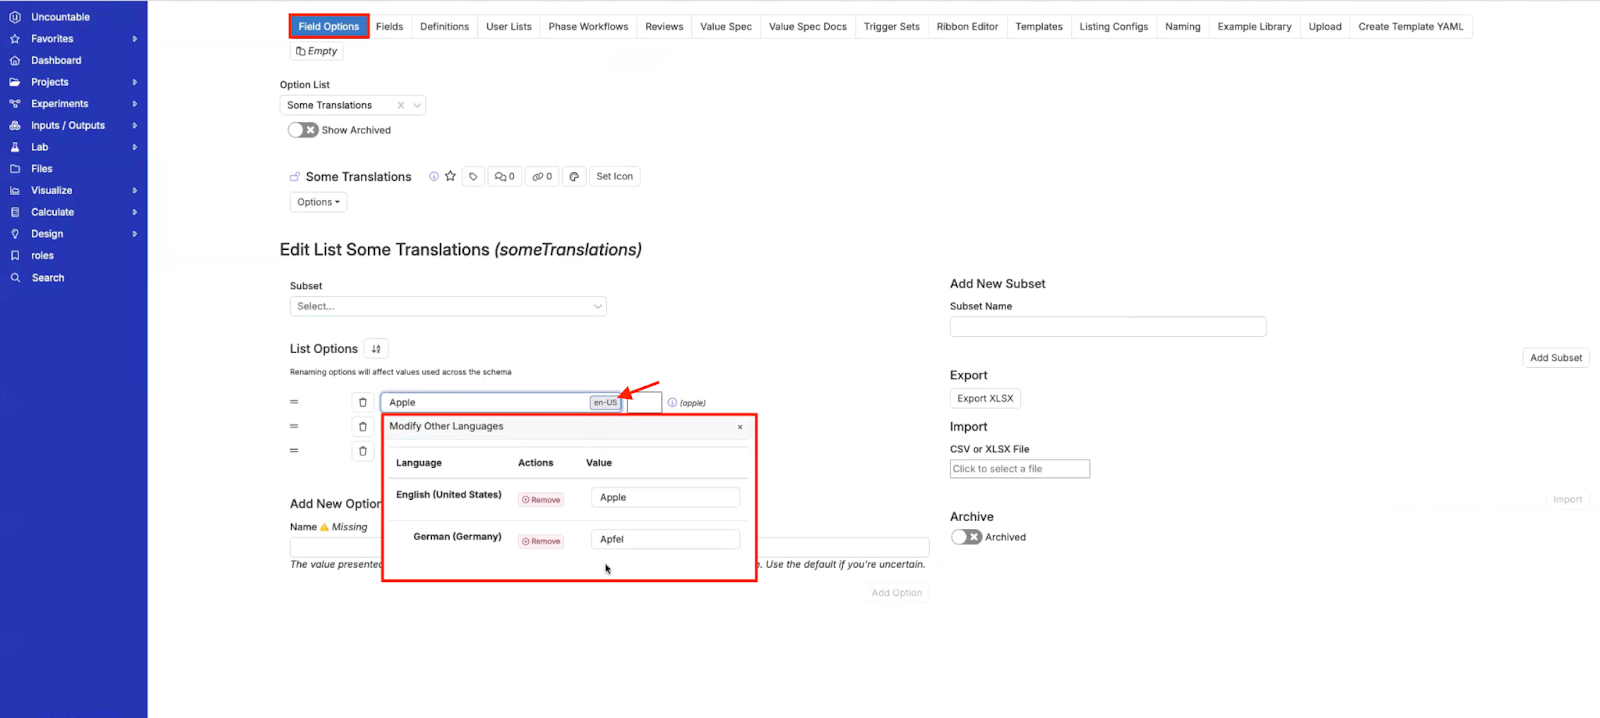
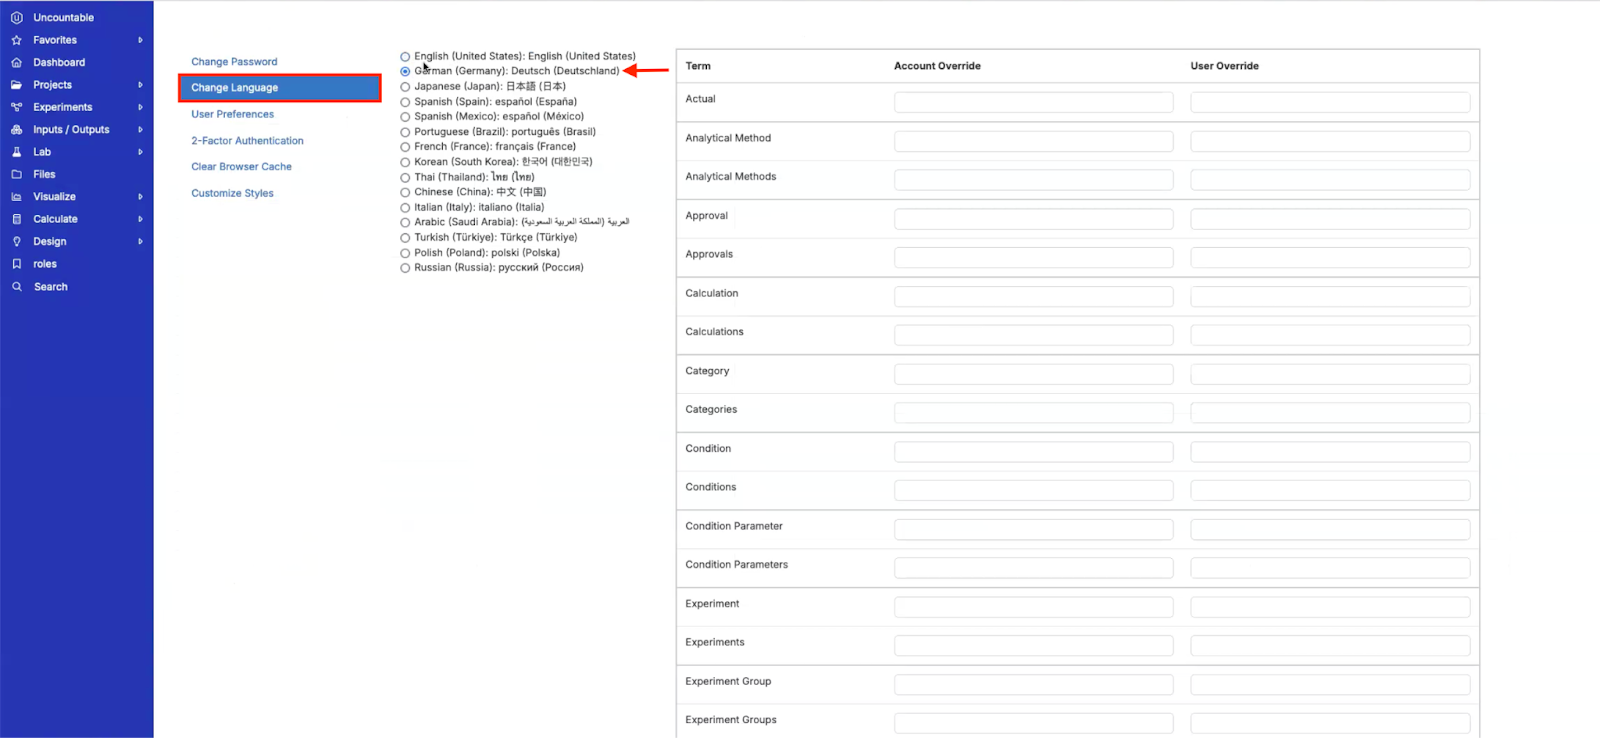
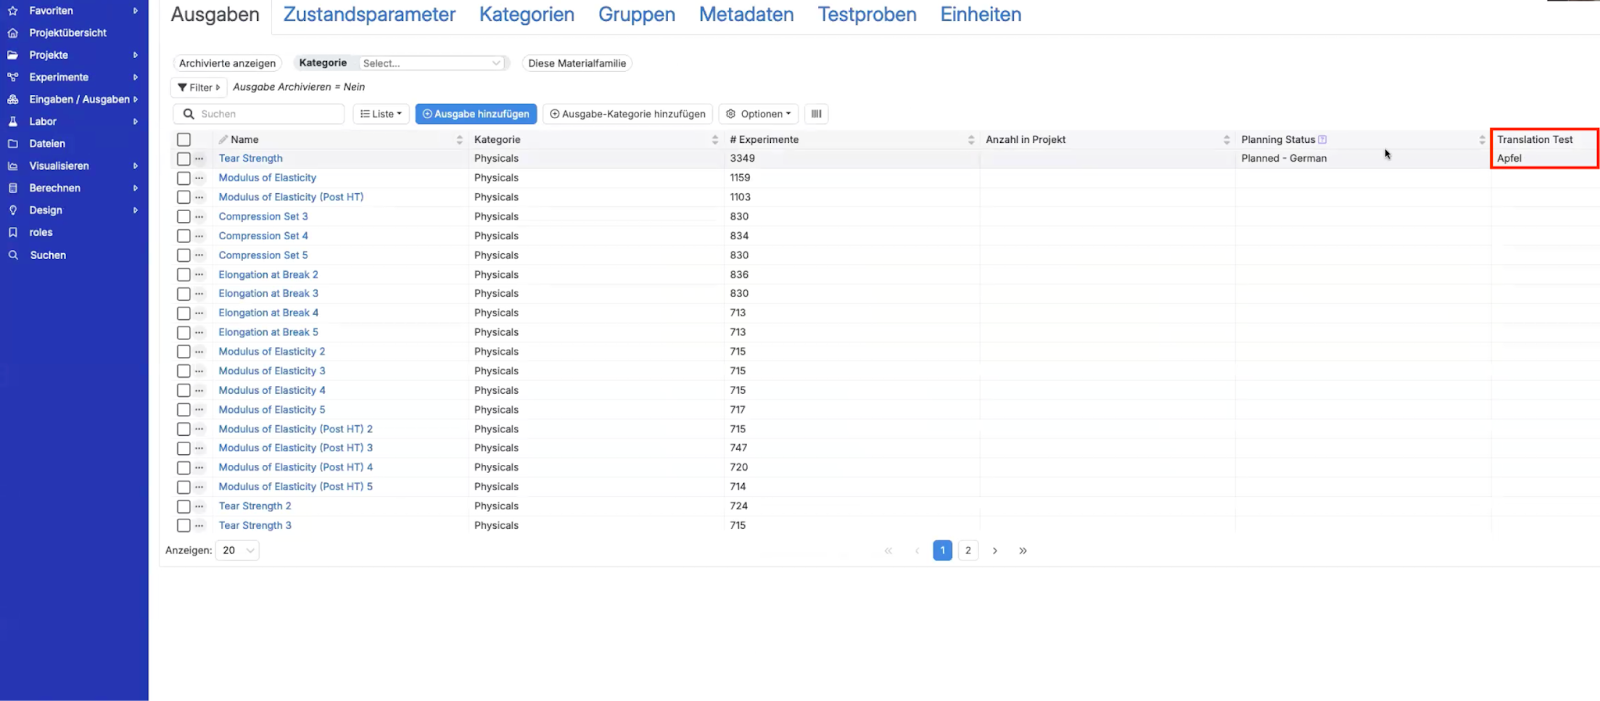
Translations for Field
A recent platform update introduces a new feature for field translations, enhancing usability across different languages.
Under the Field Options tab in the Form Admin page, users can now click the “en-US” button to access a translation window. Here, users can add translations for any specific field.
Once enabled and the language switched, the field’s term will appear translated wherever it is used, ensuring clarity and consistency across the platform.
Improved File Parsing for Multi-Header Files
An uploader update has been made to improve how Uncountable handles file parsing, especially for files with multiple headers and channels.
Previously, when creating an operator, the system would zip headers and channels together in sequence, which could misrepresent the data structure. Now, users can handle such files more accurately by modifying the following settings:
- Uncheck New File Structure Option: This prevents the default behavior of zipping headers and channels together sequentially.
- Check Group by Contiguous Channels Flag: This new feature ensures that channels are associated correctly with their respective headers. When enabled, it groups the channels appropriately, reflecting the intended file structure.


Improved Handling of Single Continuous Channels
Uncountable has also introduced an update to enhance the handling of single continuous channels with a new feature in the uploader.
A new option, Start New Channel Only if Ended, addresses issues previously caused by repeated headers in files with a single continuous channel. This option ensures that after an initial header match, subsequent repeated headers are ignored, consolidating all data into a continuous channel.
This improvement maintains the intended file structure and prevents fragmented channels.


Improved Side Panel on Mobile Devices
An update to the mobile UI determines side panel size based on screen size rather than mobile device type.
Previously, opening the side panel on mobile devices like iPads would cover the entire screen, making it difficult to interact with other buttons. The new update resolves this issue and ensures that the side panel occupies a more reasonable amount of screen space.

Enhanced Side Panel Resizing on Touch Devices
A recent update has improved drag events in the mobile user interface.
This change was aimed to resolve challenges resizing the side panel on touch devices. The new interface makes resizing the side panel smoother and more intuitive, allowing mobile Uncountable users to make adjustments easily without disrupting their workflow.

New Entity Lock on Experiment Metadata Rows
Uncountable now allows users with the correct permissions to add locks to experiment metadata rows.
This feature enables users to disable specific fields within experiment metadata, preventing further changes until the lock is removed. It enhances control by ensuring that critical information remains consistent and secure.

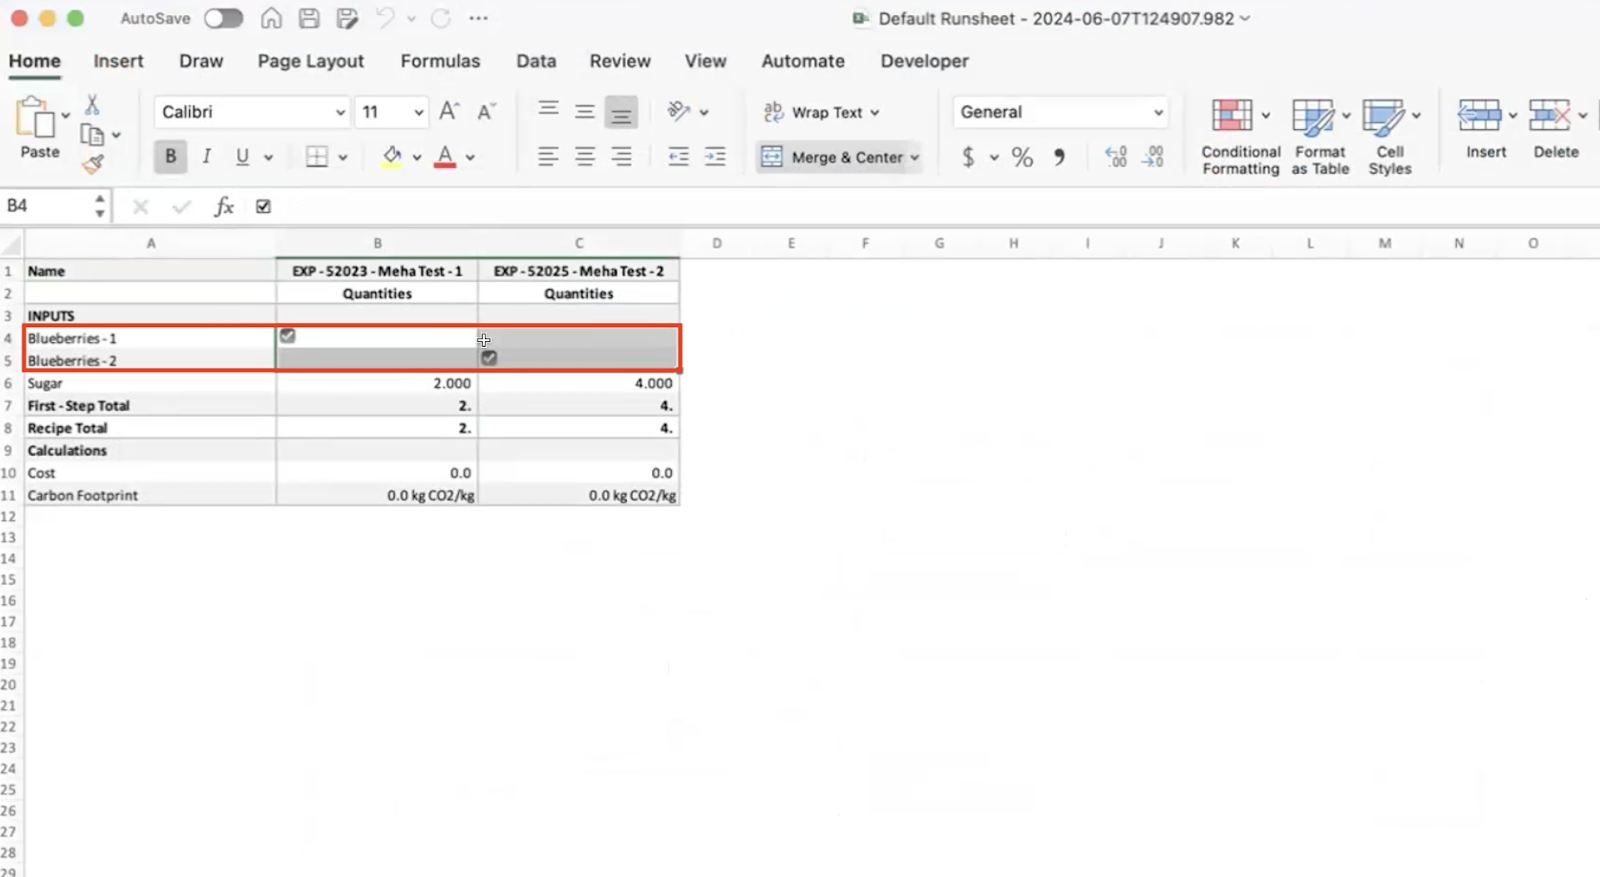
Improved Placeholders in Recipe Export
Uncountable has enhanced recipe exports from the Enter Recipes page by correctly displaying placeholders as checkboxes on the downloaded runsheet.
Previously, placeholders appeared as empty spaces on runsheets. With this update, checkboxes now clearly indicate which recipes have placeholder values, improving usability during recipe management.
Customizable Test Sample Names
Uncountable now allows users to individually modify each test sample name when creating new samples, offering enhanced customization options.
To utilize this feature, select “+ Create New Test Samples” from the top toolbar and expand Modify Test Sample Names. This allows for greater customization and clarity in test sample naming.

Standardized Listing Actions
A recent update has standardized the display of entities and run actions across different types of listings.
These actions now appear at the bottom of the listing and in the dropdown menu. Filtering options have also been added to the listing action dropdown for consistency.


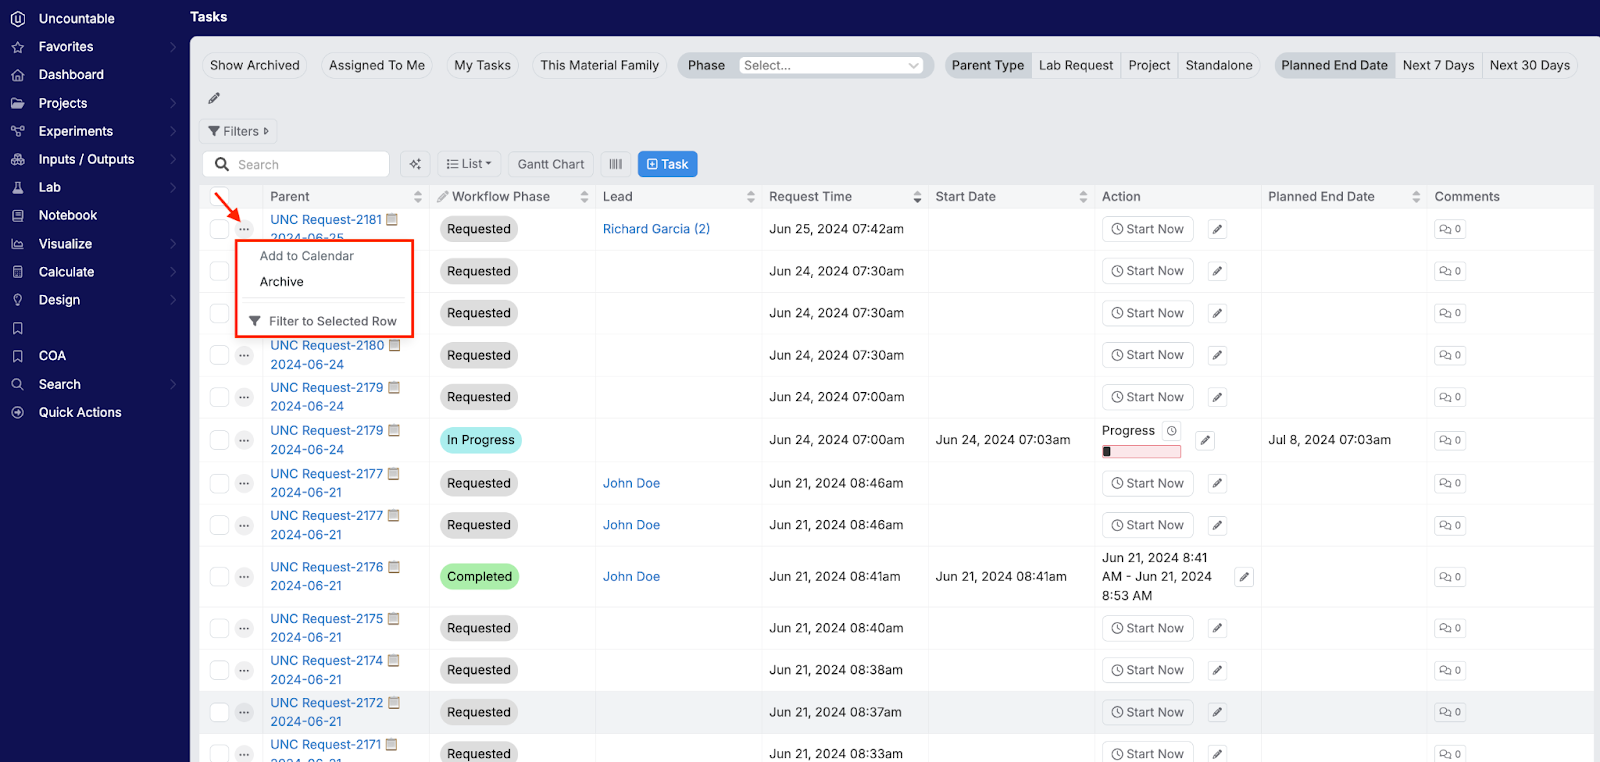
Task Listing Improvements
Uncountable has updated task listings to enhance usability with a more standard format for the listing actions dropdown.
Previously, options were displayed in a column within the table. Now, they are accessible by clicking the “…”, opening a dropdown menu associated with the task.
These updates aim to improve accessibility and consistency in task management within the platform.
5/10/24
- Clicking on a dropdown cell in the enter pages will cause the dropdown to open, without needing to click a second time.
- The size of chemical structure drawers can now be manually adjusted in notebooks.
4/26/24
- Aggregated listings can be added directly to a notebook.
- Similar entity search is now available on structured listings.
4/12/24
- Recurring calendar events can be configured.
- Speech recognition interface was added to the quick command menu.
3/28/24
- Aggregated structured listings are now aware of the user’s local timezone.
- Structured listings now have a keyboard manual, which is available under the “List” dropdown.
3/15/24
- The structured listing UI now has more distinct cell borders, column headers, and focus indicators.
- Mobile device support was added for structured listings.
3/1/24
- Inline instructions in recipes with a mix order are now included on the compare page.
- Favorites with custom urls are now supported on the navigation bar.
2/16/24
- The entity page sidepanel for inventory records is now accessible on the barcode tracking page when the barcode for an inventory record is scanned.
- Entering the barcode for an inventory location on the barcode tracking page will allow users to view a listing of inventory located there.
2/2/24
- Added option to open a sidebar view of experiments linked to the samples attached to a lab request
- Specs now support “Range With Target Range” goals where a required range and a desired range are both specified
1/26/24
- Alignment can now be set set on images in notebooks.
- Images can now float freely on the notebook page.
1/19/24
- Ingredients can now be bulk-removed from an experiment on Enter Recipes
- Color difference equations (Delta E) are now supported in Suggest and Analyze Experiments
1/12/24
- Test Samples can now be copied from the Enter Measurements view
- Create Project button can now be hidden based on permissions
1/5/24
- File Attachment Process Parameters are now available
- Webhooks can now be configured in Uncountable
12/15/23
- Ingredient Placeholders can be configured to appear on New Experiment and New Test Sample forms
- Defaults can now be configured for Ingredient Roles
12/8/23
- Experiments can now be associated with Phase Workflows
- Output Categories can now be configured to be shown or hidden when an experiment is surfaced as a test sample
12/1/23
- Numeric ingredient attributes now support annotations
- Recently Viewed experiments are now available as a listing
11/17/23
- Comment Threads are now available on page headers of various entities
- Ingredient Names can now be highlighted on Enter Recipes using metadata (e.g. to flag regulated ingredients)
11/10/23
- Process Parameters of Test Sample experiments can now be viewed on Enter Measurements
- Process Parameters now support time-based units
11/03/23
- Any entity can now have a comment thread associated with it
- Condition Parameters now obey rounding settings (e.g. Scientific Notation)
- Suggest and Analyze Experiments now support L*a*b goals
- Suggest Experiments now supports masking predictors
10/27/23
- Users can now specify which workflow steps to pull process parameters from in calculations
- There is a new dropdown under tasks, where users can view the task list as a kanban board
10/20/23
- Users can select multiple experiments and/or test samples at once and allow them to apply the same chain of custody information
- Users can now copy workflow variants between material families
10/13/23
- Users can show highlighting for ingredient calculation constraints within the enter experiments page.
- Allow archiving inactive condition parameter options to reduce visible clutter
10/06/23
- Users can set triggers for ingredient attribute values on form admin
- When exporting a notebook to a powerpoint, font colors and stylings apply
09/29/23
- Users can now upload YAML files to the form admin to generate fields
- Multiple material families can now share a workflow, updating this workflow will propagate those changes to the workflows within the material family
09/22/23
- Added witness column to recipe inputs so users can mark inputs as witnessed vs not witnessed and take notes on the event
- Users can now add equipment to recipe steps from the enter recipe inputs page
09/15/23
- Implemented Chemical Search feature for searching chemical structures within notebooks and experiments
- Users can add tags to calendar events
- Users can search for images within different notebooks via the search tab
09/08/23
- Users can now upload TIFF images to notebooks
- Suggest page UI changed, new UI centers around the type of constraint set selected
09/01/23
- Users can now lock calculations for workflow steps
- Implemented locking and unlocking ranges of quantities for experiments
08/25/23
- Users can lock experiment test samples when locking the experiment
- Curves now exclude outlier curves from averages
08/18/23
- Users can add a time column to custom entities
- Implemented a Gantt chart for lab requests
08/11/23
- Added mix order support in the recipe importer
- Admins can set permissions for who can edit recipes for a material family
07/21/23
- Entity uploader supports importing field values by name instead of ID
- Users can select multiple experiments to add to a well plate
07/14/23
- Users can @ mention other users from within a notebook
- Users can mark calculations as intermediates in an experiment
07/07/23
- Users can set user-specific format overrides on the experiments page
- The uploader now supports copy/pasting cells
06/30/23
- Users can now mass archive experiments through the bulk modify page
- Calculations with associated steps will now display a step calculation for each matching workflow step in a recipe. Previously, we only displayed a calculation for the FIRST matching working step in a recipe
06/23/23
- Users can now configure placement, sizes, and visibility of sections in the well plate editor
- Workflow steps may now be marked as “never final” to indicate that they will not contribute to the final quantity of a formulation
06/16/23
- Users can now copy ingredients/outputs/condition params/ingredient categories/output condition param settings from one material family to another using the new Copy Material Family page
- Headers and footers are now supported in workbooks and included in exports
06/09/23
- When using the transform condition parameters modal, users can now select parameters such that only conditions will only transform when they are are missing as well as scope the transform condition parameters to specific outputs
- Lock constraint sets can now be saved and loaded
06/02/23
- Equipment can now be added like any other input
- When scaling recipe values, users can now select a specific step to customize
05/26/23
- Users are now notified in the Uncountable Inbox when they are tagged in a comment
- Images are now included when exporting Notebooks to Microsoft Word
05/19/23
- When values in a spec are edited on the ‘Enter Measurements’ page, these changes now also propagate to the spec itself
- Ability to color wells by ‘Control’ on Well Plate editor – this enables control experiment relationships to be seen visually
05/12/23
- Visual indication on dashboard if experiment is locked
- Ability to create naming schema for projects on front end
05/05/23
- Users can select a project for a new experiment via the add experiment modal
- Users can ungroup a single experiment from a group on their dashboard
04/28/23
- Users can specify an inventory limit on the project list page
- Users can compare cells within a notebook
04/21/23
- Users can specify permissions on the entity page
- Users can set default conditions on output groups
04/14/23
- Users can now merge attributes in calculations
- Users can now add bulk metadata
04/07/23
- Copying a recipe will now copy its locks
- Well plate ingredients are now shown as pie charts
03/31/23
- Allow users to archive/delete unused fields from forms
- Users can delete groups of goals
03/17/23
- Users can change the background and text color of buttons
- Notebook shares are now tracked in the audit log
03/10/23
- Users can highlight multiple text cells in notebooks
- Users can bulk archive inventory
02/24/23
- Output groups can now have tags
- Users can now set default calculations for step and recipe totals
02/17/23
- Users can insert snapshots of curves in notebook cells
- Normalizing will now change base quantities rather than percentages
02/10/23
- Users can archive workflow steps
- Users can set their constraint sets to either sample or explode components
02/3/23
- Users can set default workflows for projects
- Users can export well plates created from the platform
01/27/23
- Users can add experiments to existing notebooks
- Users can share notebooks with user groups
01/20/23
- Added support for Chinese and Arabic fonts
- Allow a user to set a target number of additional ingredients as varying on a constraint set for a suggest job
12/16/22
- Curve process parameters can now be graphed on the Visualize Curves page
- Advanced DOE (High throughput design) now supports saving and loading settings across project boundaries within the same material family
12/9/22
- An equation editor is now supported on notebooks
- Read / write permissions are enforced on lab equipment
12/2/22
- Workflows are now lists of steps, and variants of workflows can be created to represent step relationships
- A new curve type process parameter is now supported on the Enter Recipes page
11/18/22
- On the enter measurements page, the new analytical methods feature allows users to link documents on forms associated with substrates
- Users are now able to edit labels through a new label editor UI instead of directly through the JSON
11/11/22
- Default quantity bases can now be set for categories on the enter pages
- New relations table view is supported when viewing set/actual
11/4/22
- Structured listings can now be added to the notebook
- Calculation outputs now support setting max depth for selecting children
10/28/22
- You can now rename columns on the structured listing modals
- Notebooks can be created with the dashboard view, and charts and structured listings can be filtered on
10/21/22:
- Users can now edit experiment workflow on a per recipe basis on the Enter Recipes page
- The Explore Data page can now plot test sample children and descendants
10/14/22:
- Notebooks sidepanel view added to the Enter Recipes page
- Users can add new control types from the enter measurements page
10/7/22
- Notebooks support export of color and formatting and merging/unmerging of table cells
- Multiple inheritance supported for test samples, which allows for defining recursive calculations
9/30
- Date type calculations can now be associated with workflow steps
- When adding input groups to experiments with mix order, inputs can now be added as separate recipe step groups
9/23/22
- File uploader now supports updating multiple files at once, previewing pdfs, and uploading files from a mobile device
- Technician view added to cycle through, view, and edit test samples on the enter measurements page
9/16/22
- Experiment and recipe checks based on specs now supported
- Editing ingredient category now supported on the well plating edit grid
9/9/22
- Notebooks can now be viewed in a dashboard / sticky note style
- Test samples are now visible on the compare page
9/2/22
- Calculations can be arranged via drag and drop
- When creating a new child project, metadata fields are automatically populated from the parent project
8/26/22
- With uploaders, users can now separate data based on channels
- Users are now able to create new projects from the All Projects page
8/19/22
- Environmental testing page supports adding projects to locations on a map, associating lab requests with locations, and creating annotations
- Curve charts support multiple axes aggregated by units
8/12/22
- Powerpoint export now supported
- Well plates support editing the size and shape of plates, and color by experiment now supports unique coloring
8/5/22
- Image annotation now supported on notebooks
- Dragging and dropping recipes onto multiple wells places the recipe into all cells
7/29/22
- Multiple rows of values can be edited using the edit grid on the well plate editor
- Calculations can scale bases across the whole recipe rather than just the workflow step
7/22/22
- Hackathon projects
7/15/22
- Pie chart visualization is now supported
- Outputs can be exported as curves
- Multiple workflows are now supported on well plates
7/8/22
- Recipe listing view added to the dashboard
- Users are now able to reorder test samples a
7/1/22
- Users are able to bulk edit measurements on the enter measurements page, and metadata rows can now be pinned to the top of enter recipes and enter measurements
- Assays for a set of wells can now be configured
6/24/22
- Can now delete goals in specification search
- Can now reorder conditions when searching for specifications
2022/06/10
- Can plot derivatives of curves
- Ribbon is now customizable for individual user accounts
2022/06/03
- Filtering by project tags is now possible
- General improvements to edit uploaders page
2022/05/27
- Plotting Step Quantities Now available
- Normalization options available through calculation side panel
2022-05-20
- Inventory Limits are now available
- Trigger sets can now be edited on the frontend
2022-05-06
- Recipes can now contain only one step of a multistep recipe
2022-04-29
- Ingredient Attributes may now contain notes
- Buttons can be added to forms to perform trigger actions
2022-04-22
- Fields can now be GHS fields
- Condition rules can specify required and optional conditions when filling in outputs
2022-04-15
- Ordinals can be included in test calculations
- Spectroscopy data: can label peaks: associate max, min, etc with a given recipe in a certain project
2022-04-01
- Images can now be previewed in the image uploader
2022-3-25
- Ingredients can now have a basis set
2022-03-18
- Curves can now be zoomed in via text controls
- Can now use categorical outputs as predictors when training models
2022-03-11
- Inputs groups may now be favorited
- Neural network may now have an arbitrary number of layers
2022-03-04
- Color with x,y,z values present on enter measurements
- Pivot table – can now select aggregation type
2022-02-25
- New sidepanel view on enter pages for calculations
- Predictor masking for predictors for arbitrary outputs
2022-02-18
- Radar charts can now view access labels
- Calendar view for Gantt chart
2022-02-11
- Web content is supported on reports
2022-02-04
- Deployment of custom entity system, allowing for arbitrary entities with their own values
- Export lab statistics view
2022-01-21
- Scheduling system, allowing for notifications and other events to be scheduled
- Test samples are now grouped together
2022-01-14
- Text has a textbox option on output measurements page
- Nested test samples now supported
2022-01-07
- Tag and group uploaders together
- Option to create units in enter measurements view
2022-12-17
- Experiment Groups added to the platform
- Expanded ingredients available when the ingredient is a measurement
2022-12-10
- Added expand and collapse for grandchildren on dashboards
- Option to hide lab requests
2022-12-03
- Deployment of custom entity system, allowing for arbitrary entities with their own values
- Export lab statistics view
2021-11-19
- Visualize Curve Data from dashboard will bring along selected experiments as a filter
- Enter recipe calculation column cells will display a warning when an attribute is missing
2021-11-12
- Lots can be archived, rendering them invisible from most lot selections
- Requests can now have fields with duration formatting
2021-10-29
- Color Outputs in calculations can extract individual L,a,b,R,G,B values
- Tasks table has a comments column for adding columns
2021-10-22
- Deleting an experiment now requires typing in the word delete
- Calculations can be locked
2021-10-15
- CAS Data Import will show the SMILES String
- Calculation Columns show totals across steps
2021-10-08
- Unit conversions will be compatible with output calculations
- Attributes for process parameters can be added as columns
2021-10-01
- Products Can be configured to be present across material families
- Output calculations can be overriden in enter measurements
2021-09-24
- Output Metadata supports searching and sorting
- Output calculations will now show in test samples
2021-09-17
- Browser Tab Titles will reflect users page
- Edit Uploaders is now available from primary output page
2021-09-10
- Lab Request templates are editable in the frontend, with field definitions and ordering changeable
- Users may override the appearance of certain terms in the platform to better match company nomenclature
2021-09-03
- Output and Output groups can now have hard required condition parameters
- Customer Admins can now change the color of their navbar
2021-08-27
- HMIS Safety Fields can be added to lab requests and approvals
- Recipe Metadata Fields can be required for naming
2021-08-20
- Ingredient Selection rows will have units displayed
- Project notes can be set in add project modal
2021-08-13
- Customers are now able to upload their logo for further customization
- Specs now support Range with Target Goal
2021-08-06
- Ingredient Filters now support text substring search for attribute values
- Output Metadata Fields may now be merged
2021-07-30
- Universal Search now includes lab requests
- Admins are now configurable on a per material family level
2021-07-23
- Lot attributes can be viewed on enter recipe page as columns
- Can now view inventory filtered to a location on Edit Locations Page
2021-07-16
- Comments are deployed on lab request and report page
- Predicted vs Actual Plot on models now supports exporting to PowerPoint
2021-07-09
- Radar Plot Page now links to Compare Experiments Page
- Copy Recipe Modal will show full project hierarchy when copying recipes
2021-07-02
- Chain of Custody now available for experiment data
- Timeseries Curve uploads now available
2021-06-25
- Comment Feature available for recipes
- Option to collapse all tables in view when entering measurements
2021-06-18
- Copy Paste Excel Option now available in Enter Pages
- Support for Bar and Scatter Plots in native export to PowerPoint
2021-06-11
- Analyze experiments supports copying past jobs
- Image rows in enter measurements have an option in the header to go to compare images
2021-06-04
- Hyperlinks are supported as a new recipe metadata type
- Predicted vs Actual plots can be saved to reports
2021-05-28
- Inventory rows support a selection checkbox for moving multiple inventory items at once
- Lab request measurement groups have an option to enter notes
2021-05-21
- Input groups and Output groups have a material family selection control
- Calculations table in edit inputs supports sorting by columns
2021-05-14
- Predictions in enter recipe supports log scale outputs and showing standard deviation
- Enter Measurements color cells will show spec highlighting
2021-05-07
- Equipment metadata fields can be added and modified by users
- Workflow step relationships can be edited by using the step diagram
2021-04-30
- Ingredient lot filters support filtering on inventory amount
- Reports have an audit log display button for viewing report changes
2021-04-23
- Calculation columns support locking ingredient rows during normalization
- Measurement groups have a timeline buttons for quick addition of time tracking
2021-04-16
- Excel-style calculations are available for standard input calculations
- New unit conversions can be added from the process parameter page
2021-04-09
- In Enter Recipes, calculation columns support normalization via editing their total cell
- Outputs have output specific rounding preferences enabled
2021-04-02
- Compare view color outputs will support displaying delta values
- Ingredient lots page now have filters for filtering by their associated ingredient
2021-03-26
- Equipment can be configured to have different types of maintenance schedules
- Series colors can be updated for a radar plot
2021-03-19
- Clean up mix order option added to the organization dropdown to remove blank steps
- Ingredients have a table in the details page with counts per material family
2021-03-12
- Radar plot supports choosing two identical outputs with different conditions
- Curve aggregates in output calculations supports individual replicates
2021-03-05
- Workflow layout diagrams can be changed to be based on different algorithmic layouts
- Enter pages now have a barcode icon for accessing the barcode of a recipe
2021-02-26
- Project notebook has been moved to the dashboard as an additional view option
- Universal search supports searching recipe metadata, process parameters, and text / categorical outputs
2021-02-19
- Projects configured as products will show as tabs in the add ingredients to recipe modal
- Curve outputs can be included in output calculations as aggregates
2021-02-12
- Explore viz plots saved to workbook will automatically have a snapshot taken when added to the workbook
- Approval workflows supports more complex approval conditions
2021-02-05
- Curve outputs are enabled in Anova
- Lab requests can be marked as complete from within the lab tasks page
2021-01-29
- Workflow editor supports creating new workflows
- Inventory locations can be assigned to grid locations within their parent location
2021-01-22
- Event logs are available in lab requests to show all changes made
- Radar plots now support more advanced range options such as overriding the default ranges, inverting the ranges, and using a log scale
2021-01-15
- Radar plots now supports more advanced option selections
- Condition parameters support notes that will show up in the add measurements to recipe modal
2021-01-08
- Enter recipe page supports clearing all empty rows
- Select projects page supports sorting by name, creation date, last edited experiment and showing by folder tree
2020-12-25
- Lab tasks are now separated out by timeline with a toggle for showing or hiding timeline based tasks
- Output groups can be set as favorites from the add measurements to recipes modal directly
2020-12-18
- Automatic outlier detection and warning is enabled in enter measurements
- Condition parameters can be made to organize measurement tables
2020-12-11
- Recipe importer supports adding a column to specify the ingredient lot name
- Report templates support adding strings like project names and material family names to forms
2020-12-04
- Universal search supports searching calculations, projects, and ml jobs
- Categorical Outputs are now supported in specs
2020-11-27
- Enter Recipes Page now has a dropdown option to normalize all experiments at once
- Enter Measurements has a new Metadata secution with an Add Metadata button
2020-11-20
- Universal search is accessible via a search icon in the navbar
- Objective search results tables can be saved to the notebook
2020-11-13
- Export All Attachments is available in the Export Dropdown in the Notebook
- Dashboard Search bar supports upper and lower case `or` for multiple terms
2020-11-6
- Explore View Plots in the Notebook can be made to have a square aspect ratio
- Ingredient Attributes can be shown in the Constraints page
2020-10-30
- Inventory Locations Page improvements such as ability to expand / collapse inventory and sort by name
- Selecting multiple cells in Enter Recipes Page will display the sum over the selected cells
2020-10-23
- Individual User Groups can now have export experiment controls applied
- Multi-step experiments are better supported in Calculate Predictions
2020-10-16
- Workflow graphs are available to view in the Suggest Formulation Page
- Experiments can be added to reports or the notebook from the Enter Measurements and Enter Recipe Pages
2020-10-09
- Plot templates support saving multiple graphs at once to reports or the notebook
- Recipe metadata can be edited from the Enter Recipe Page
2020-10-02
- Factorial Design Of Experiments is available in Suggest Formulations
- Reports can be deleted from the reports table
2020-09-25
- Input values in Calculate Predictions can now be locked
- Project Information Cell and Project Planning templates are available in the Project Notebook
2020-09-18
- Excel Copy Paste in the Project Notebook can automatically create a new custom table
- Inventory locations can be fully specified in a hierarchy
2020-09-11
- ANOVA view now supports ingredient in categories as categorical options
- Prediction Profiler is available for Analyze Experiment Results
2020-09-04
- Project Notebook now supports drag and drop for files and images from the desktop
- Suggest Experiments results now contain a surface plot like in Design Experiments
2020-08-28
- Custom Table in the Project Notebook supports changing background color of cells
- After a new model is trained, Option to compare error rates with past models is now available
2020-08-21
- Lasso selection is available in the Analyze Results page for changing points displayed in the plot
- ANOVA view has been released under the Calculate tab
2020-08-14
- Project Notebook Reports can be locked and signed
- Inventory history is available for listing inventory levels over time
2020-08-07
- Lasso selection has been added to Explore Viz plots to allow selecting points with the cursor for filtering and comparison
- Sklearn models are available in Analyze Experiments
2020-07-31
- Reference section is available in the Project Notebook to link to recipes and lab requests
- Custom sorting option is available on the dashboard for by a process parameter or an ingredient
2020-07-24
- Descriptions, notes, and other text boxes support linking to recipes on the platform
- Recipe read only page now supports viewing ingredient lots inside the ingredient name dropdowns
2020-07-17
- Workbench table in project notebook and reports supports steps, recipe notes, and other features from the workbench
- Image Comparison has new options to add a border around images, defaulting images to a larger size, and centering images
2020-07-10
- Constraints can be set on a weight percentage or volume percentage basis
- Child projects will inherit metadata from parent projects at creation if the metadata is visible in the Select Projects page
2020-07-03
- Correlation view sankey diagram can now be saved to project notebook
- Lab Request Page now support role management for lab request watchers and consistent notifications
2020-06-26
- Explore Visualization now support option to create a chart grid
- Template Plot View is now available in Explore Visualization to view plots based on other projects experiments
2020-06-19
- Set All Lots Column is available in Enter Recipes View
- Project Notebook now support Custom Tables that are exportable to Word
2020-06-12
- Analyze experiments guide now includes an option for Uncountable guided feature selection
- Recipes and Outputs marked as outliers can be excluded from explore and correlation views
2020-06-05
- Constraint sets now include calculations that can be used as features in models
- Ingredient compositions are viewable in the Enter Recipes page
2020-05-29
- Integral option are added to output curves for filtering and plotting
- Inventory requests for ingredients can be submitted from the Ingredient and Inventory pages
2020-05-22
- Suggest Experiments, which auto-selects an ingredient set, is available under Design
- Past Design Jobs will include training jobs
2020-05-15
- Unit conversions are available in Spec Pages and Objective Search
- Outputs can have attributes including files associated with them
2020-05-08
- Ingredient lot attributes now have option to be categorical
- Calculations are now sortable within the platform
2020-05-01
- Ingredients and Outputs values can be selected to color table cells in image comparison
- Recipe comparison plots now have the ability to have standard deviation error bars
2020-04-24
- Lab requests now have the support for adding timelines to whole groups of outputs
- Recipes can be set as a template for a project such that new recipes are created as blank copies of the template
2020-04-17
- Output outliers can be excluded from graphs in the Explore Visualizations Pgae
- Outputs can be set to display in scientific notation
2020-04-10
- Ingredient filters allow searching through the description or notes of ingredients
- Curve View now has option to turn off bezier smoothing and ability to customize title
2020-04-03
- Fix header and column is deployed across Enter Measurements and Enter Recipes Page
- Reports in Project Workbooks are enabled with customizability for default form cells
2020-03-27
- Top Level Recipe Calculations can use Process Parameter values from Component Recipes
- Form Cells are now available in Project Workbooks for text values
2020-03-20
- Ingredient attribute columns in Enter Recipes Page will now persist after refresh
- File type Ingredient Attributes uploads can be performed directly from the ingredients table
2020-03-13
- Previews for PDF Files are now available in Enter Measurements and Ingredient Details pages
- Explore Visualization now include more non-linear regression options
2020-03-06
- Projects can be set to have default ingredient filters
- Ingredient filters now have more options such as filtering by lot properties
2020-02-28
- Projects can now be organized in a hierarchical fashion allowing for parent and sub-projects
- Pdf file uploads can be previewed in the Project Notebook
2020-02-21
- Design Experiment tool now supports platform calculations
- Additional undo support available in Enter Formulations and Enter Measurements Page
2020-02-14
- Project Notebook now supports files uploads for various file types
- Correlations for component outputs of a recipe to outputs of a recipe are now available in Correlation View
2020-02-07
- Copy paste dropdown on Enter Inputs/Measurements now allows Fill Value and Include Notes/Annotations modes
- Creating a new Ingredient or Output now shows similarly named items below the input box
2020-01-31
- Subcategories now available as a column in enter ingredients table
- Dates can now be displayed in histograms in Explore Visualizations Page
2020-01-24
- Box and Whisker plots available in Explore Visualization Page
- Measurements now have annotations to enable additional symbols to appear
2020-01-17
- Can now automatically normalize ingredient values to a given scale
- Added ability to display points that most influence model predictions
2020-01-10
- Ability to create Unit Conversion Groups now enabled for measurements
- Can view Ingredient Attributes columns in Enter Formulations View
2020-01-03
- Lot Attributes can now be assigned to multiple ingredients
- Plotting by Projects and Recipe Metadata now available in the Custom Value Modal
2019-12-27
- Tooltips of replicate cells in Enter Measurements now include Summary Statistics
- Project Specs and Constraints can be transfered across different projects
2019-12-20
- Can now navigate to Visualizations from Enter Measurements and Compare View
- Predictions now display a red, yellow, or green icon as a proxy for the predicted value
2019-12-13
- Improved organization of outputs and their conditions in Edit Measurements Page
- Can now edit tags and set formulations with certain tags to top of dashboard
2019-12-06
- Test Condition Matrix now available in Add Output Modal
- Can toggle between Material Family or Project Specific categories
2019-11-29
- Can now display Condition Parameter hierachy
- Correlation Matrix available in Correlation View
2019-11-22
- Ingredient Attribute plotting is now available
- Runtime Conditions are now available
2019-11-15
- New Constraint interface available for creating screening DOEs
- Identical Comparison view allows user to see number of formulations
2019-11-08
- Input groups are now available
- Can set tags when adding new formulation
2019-11-01
- Can now sort formulations by when they were last edited
- Output groups now available
2019-10-25
- Lab Workflow now notifies relevant users
- New Zealand inventory status displayed for ingredients with CAS numbers
2019-10-18
- Normalize Enabled in predictions view.
- EC Data now pullable from CAS number in ingredient view.
2019-10-11
- Able to filter for project metadata.
- Calculation Status displayed in calculation view.
2019-10-04
- Interaction view enables filtering.
- Color scales now supported in workbench.
2019-09-27
- Calculations can now be created by users in the system.
- Allow curve aggregations in output calculations.
2019-09-20
- Improved graphing of dates in line graph view.
- Custom color maps available in surface plot view.
2019-09-13
- Categories can now be assigned to multiple ingredients at once.
- Ingredient attributes can now be categorized.
2019-09-06
- Edit formulations page restyled to better match traditional Excel view.
- Multiple File Upload for import of machine data supported.
2019-08-31
- Ternary Plots available on platform.
- Interaction plot now available.
2019-08-24
- PDF Export Available from Platform.
- Calculated Outputs now supports dynamic equation setting.
2019-08-17
- Graphing of text array fields now available.
- GHS Hazards available as descriptors for ingredients.
2019-08-10
- Best Fit line available in explore data.
- Filters available in Objective Search.
2019-08-03
- View to compare identical formulations.
- Can now set lots when adding ingredients.
2019-07-27
- Option to create multiple measurements at one time.
- Displaying and accepting of scientific notation when appropriate.
2019-07-20
- Speedup for explore visualization.
- Compare Formulations cutting off display of long strings that will not fit.
2019-07-13
- Basic Inventory View supported.
- Redesign of icons for platform.
2019-07-06
- Axis settings now available in Curve View.
2019-06-30
- Error bars displayed for replicate meausrements in Explore Visualization.
- Permissions for individual recipe metadata fields supported.
2019-06-23
- Public data about ingredients structure and molecular weight now shown.
- Notes about formulation measurements supported.
2019-06-16
- Parameterized Outputs now supported.
2019-06-09
- Screening generation redesigned to be more robust.
2019-06-02
- Entering measurements and ingredients now validates that a numerical value is added
- Measurements now have a more details page available, describing their test characteristics.
2019-05-25
- Predictions Page now recommends a formulation, when the existing one cannot be predicted
2019-05-18
- Ingredients Page now supports going directly to formulations containng ingredient.
- Surface Plot Recommendations Available.
2019-05-11
- Parsing COAs now available.
- Pasting from Excel supported.
2019-05-04
- Undo support on edit measurements page.
- Sortable Columns on Enter Measurements.
2019-04-27
- Ingredient Lot names now displayed next to ingredients when applicable.
- View for comparing identical formulations.
2019-04-20
- Support for multi-step workflows.
- Switch Project now available from dashboard.
2019-04-13
- Formulation Metadata now has support for graphs.
- Color Picker for Surface Visualization.
2019-04-06
- D2000 Specification Import Support.
- Improvements for Surface Visualization.
2019-03-31
- Allow graphing of ingredient lot information.
- Speedups for explore visualization.
2019-03-17
- Graphs exportable to PPTX from notebook
2019-03-10
- Added Compare Images View.
- Added Support for graphing Formulation Tags.
2019-03-03
- Progress Visualization in Executive Dashboard.
2019-02-24
- Executive Dashboard supports viewing scients progress.
- Can now edit multiple measurements at a time.
2019-02-17
- Support for Ordinal Measurements.
- Titles of pages now displayed in Navigation Bar.
2019-02-10
- Can now edit multiple formulation inputs at a time.
- Titles of pages now displayed in Navigation Bar.
2019-02-03
- Units are now required for measurements.
- More robust permission granularity supported.
2019-01-31
- Added support for tags for formulations.
- Bulk copy of formulations is now supported.
2019-01-27
- You can now export a set of ingredients or measurements to a CSV.
2019-01-22
- It is now possible to delete formulation lots.
2019-01-18
- Support for ingredient attributes that are PDFs.
2019-01-17
- Support now included for universally required ingredient attributes.
2019-01-14
- 2D Surface Visualizations now available of created predictive models.
2019-01-10
- Project Notebook capabilities expanded. Project workbooks include the ability to graph scatter plots, contour plots, as well as various tables.
2019-01-04
- Calculations shown are now customizable.
2019-01-04
- Calculations shown are now customizable.
2018-12-27
- Curve data can now be filtered on.
2018-12-18
- Images can now be stored as attributes of ingredients.
2018-12-18
- Log stored of merged ingredients and measurements.
2018-12-17
- Process Parameter copying now toggleable when copying a formulation.
2018-12-05
- It is now possible to compare formulatons from the visualize page.
2018-12-02
- Recipes can be removed from the compare view.
2018-11-06
- It is now possible to create new material families.
2018-11-05
- Executive Dashboard View Now available on platform.
2018-10-29
- It is now possible to generate screening experiments on the platform.
2018-10-18
- A Curve Visualization view is now available, allowing you to Compare curve measurements across different formulations.
2018-10-15
- It is now possible to have measurements that are numeric ranges.
2018-10-10
- Surface visualization of model is now available on platform. To request a visualization, please email info@uncountable.com
2018-10-04
- Can Now merge ingredients and outputs on platform.
2018-09-20
- Correlations View Now Support ingredient categories, and transforms of output function.
2018-09-10
- Ingredients View Now Supports viewing ingredient attributes.
2018-08-29
- Project Workbooks now support file upload and download.
2018-08-24
- Project Owners are now displayed on the product selection page.
2018-08-23
- Normalize Formulation Button added to the platform.
2018-08-18
- Custom calculations are now supported. These can be for derived values like cost, or other calculated values.
2018-08-13
- Ingredient Tags can now be searched for.
2018-08-04
- Ingredient Lots have been added to the platform. These can be tied to single formulations / ingredient pairs.
2018-08-04
- It is now possible to graph output to output correlations.
2018-08-04
- It is now possible to save and load visualizations.
2018-08-03
- In addition to categories, ingredients may now have tags describing them.
2018-07-21
- Compare Formulations now has the option of adding ingredients and measurements.
2018-06-30
- Can graph the primary ingredient used from a category.
2018-06-29
- Can now filter by custom values, such as an average of ingredient attributes.
2018-06-19
- Can now import notes from CSV.
2018-06-15
- Clicking a formulation in the explore view will now go to that formulations page.
2018-06-01
- Can now use recipes as ingredients for other recipes.
2018-05-24
- Can now graph values from single set of experiments.
2018-05-20
- Can now upload images to the project notebook.
2018-05-06
- Can now remove formulations from compare view
2018-05-03
- Ability to bulk import formulations into another project now available.
2018-05-01
- Graphing for dates now available.
2018-04-30
- Can now graph formulations by the weighted sum of their attributes (i.e cost).
2018-04-26
- Can now graph formulations by their output standard deviations.
- Can now graph on a linear or logarithmic scale.
- Can now graph categorical and text variables.
2018-04-06
- Can now rename experiments.
2018-04-04
- Can filter by ingredient category quantities in ingredients view.
2018-03-26
- Can filter by a minimum number of samples in correlation view.
2018-03-08
- Can add in new attributes when adding new ingredients, or editing existing ones.
2018-03-05
- Notes for inputs and outputs now appear as tooltips.
2018-03-04
- Added the ability to filter by quantities of an ingredient category.
2018-02-27
- Added the ability to filter ingredients and outputs by a range in dashboard.
2018-02-26
- Histograms now display on the input and output view.
- Explore data can now graph ingredient attributes.
- Can now filter ingredients by their attributes, creation date, and last use date.
2018-02-17
- Changed the navigation to make inputs and outputs accessible from projects page.
2018-02-12
- Can now export data from explore visualization.
- Can now navigate to previous and next formulation from within a formulation.
2018-02-08
- Can edit formulations from compare formulations page.
- Persisting filters across multiple views.
2018-01-30
- Added the ability to add an existing formulation to another project.
2018-01-29
- Fixed issue affecting outputs in formulations with multiple experiments.
2018-01-07
- Date input type has been added.
2018-01-04
- Corrected Sorting for ingredients and measurements
- Formulation Date Filtering is now based on the users timezone
- Hovering over input and output values on dashboard now displays a histogram
2017-12-30
- Visualization tool added for viewing correlations between inputs and outputs.
2017-12-30
- Speedups for correlation visualization.
2017-12-29
- Project Selection Page now has search functionality.
2017-12-27
- Input and Measurement pages now have search functionality.
2017-12-19
- Output curves can now be uploaded
2017-12-17
- A correlation visualization has been added to the suite of visualizations.
2017-12-16
- Images can now be uploaded for output values.
2017-12-14
- It is now possible to filter formulations based on their creation date.
2017-12-05
- Outputs can now have units associated with them.
2017-11-27
- The explore visualization now has filtering capabilities
2017-11-22
- Filters on dashboard are now saved between visits.
2017-11-15
- Added an option to each formulation to specify whether it needs testing.
2017-11-12
- Modified the method for adding inputs to a formulation.
2017-11-07
- Inputs and Outputs can now be text based.
- Added quick filtering on formulation dashboard page.
2017-11-06
- Formulations can now be imported into other formulations.
- Fixed issue affecting CSV export in Firefox.
2017-11-05
- Formulations can now be edited outside of projects.
- Added Copy Formulation Button.
2017-11-04
- Ingredients and Outputs now separated out by material family.
2017-10-25
- Styling of settings pages updated
2017-10-24
- Change Log Implemented
2017-10-20
- Projects now support a material family
- When hovering over the project metadata section on the dashboard page, a pencil now appears
2017-10-19
- Dashboard View updated to allow editing project owner, start date, and name
- Multi-Factor Authentication name changed to Two-Factor Authentication
2017-10-15
- Full Export of Data available from the platform
- When creating a new project, it is now possible to enter in a project template, if one exists
- Select Ingredients and Outputs performance improvements with a large number of ingredients or outputs