Uncountable’s platform is able to store and display many types of data and media, including images from across different experiments. The Compare Images tool is one helpful way to conduct your visual analysis.
To access the Comprare Images interface, select the Visualize button at the top of the Dashboard, navigate to More Visualizations, and locate the View Compare Images option in the second row from the top.
Setting up the visualization
Once clicked, the View Compare Images button will bring users to the Compare Images landing page. At the top of the page, users can enter in the specific experiments outputs, and settings to tailor the visualization to their specific needs.
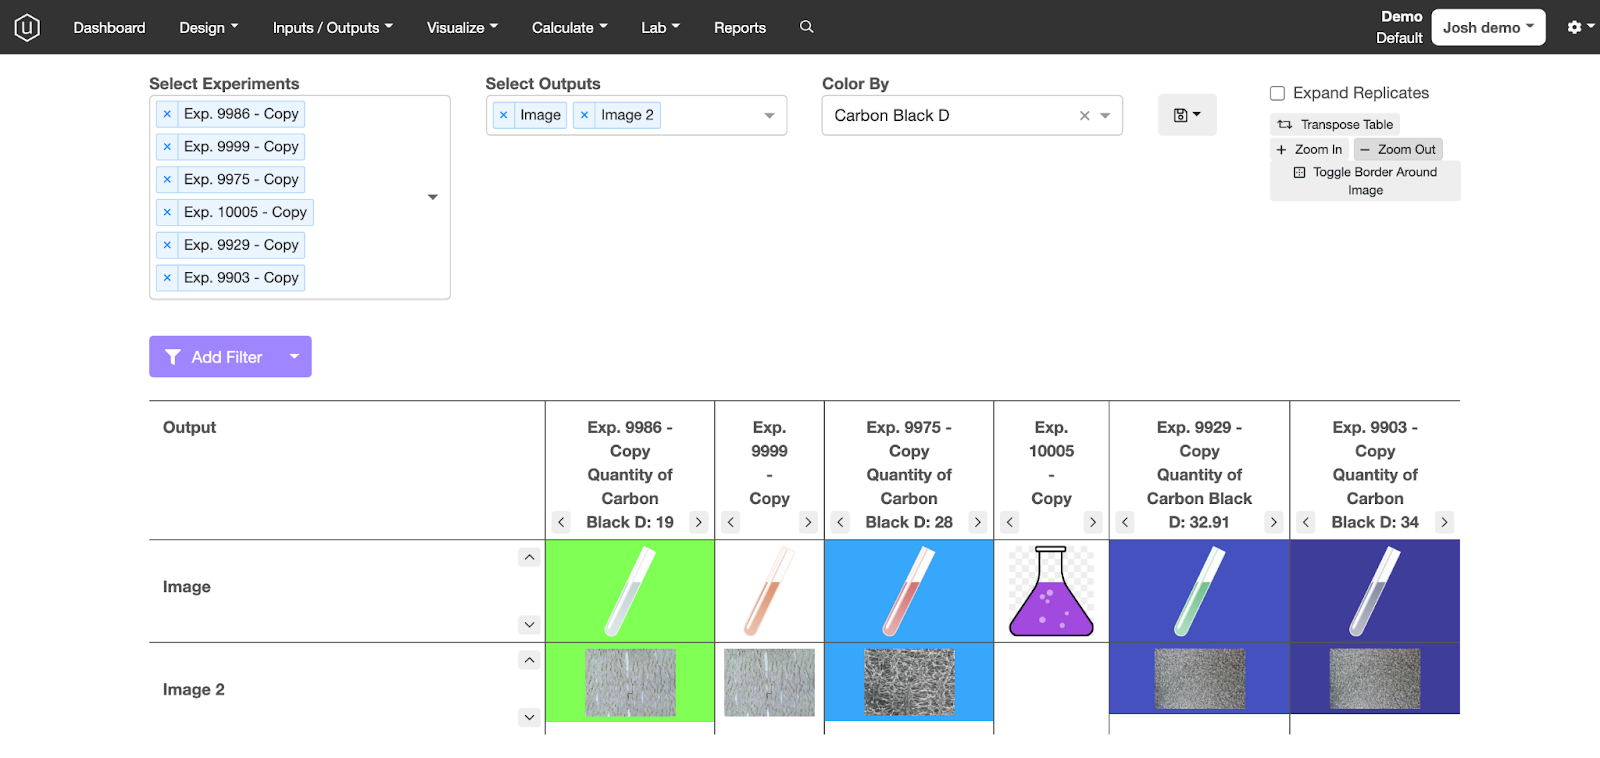
The Select Experiments dropdown menu allows users to choose which experiments they want to be displayed within the generated chart.
The Select Outputs dropdown menu allows users to choose which of an experiment’s associated images they wish to display in this visualization.
Finally, the Color By dropdown menu allows users to easily identify shared traits by color-coding each instance of the selected property in the visualization. A user’s images will be colored along a green-blue gradient––the lighter the green, the less of the selected property is contained within that experiment, and conversely, the darker the blue, the more of the selected property is contained within the experiment.
Formatting settings
To the right of the three dropdown menus there are a variety of features which allow users to format and save the resultant visualization.
Immediately to the right of the menus, there is a save icon which allows users to save their visualization or load a previously-created one. For step-by-step instructions on how to save a visualization, please refer to the support guide.
To the right of the save icon, there are a series of buttons which allow users to adapt the scale and format of their visualization.
The Expand Replicates button allows users to include various iterations of the same experiment within the visualization (which are able to be toggled through by clicking on the arrows above each image). If selected, the Expand Replicates button will automatically label each image with the specific iteration displayed (only one replicate can be displayed at a time).
To invert the rows and columns of the table for ease-of-use, a user can select the Transpose Table button.
To zoom in or out on the table, depending on its size, users can click on the Zoom In and Zoom Out buttons.
Users can also create a black border around each image by clicking on the Toggle Border Around Image option.
Filters
Below the dropdown menus is a Add Filters button which allows users to filter the images displayed in the visualization based on specific criteria.
By clicking on the Add Filters button, the usual Uncountable filtering interface will appear. A table of dropdown menus will appear, allowing users to select the filters and categories by which they would like to sort their visualization. For example, a user could sort by the request status within a particular material family and further narrow down the search by selecting only those tasks currently in progress. If a user wants to filter their visualization by an input, they can further specific which specific mix steps are included and can normalize the results for a percentage. Some filters also include an exclude option, denoted by ≠, which will call up all of the lab tasks which do not fulfill the given condition.
By clicking on the arrow next to the Add Filter button, users can autogenerate a specific filter field: Add Filter, Filter By My Experiments, Filter By Date, Filter By Tag, Filter By Experiments In My Project. If a user presses the More Shortcuts button, two further filtering options will appear: Filter By Experiments with No Ingredients and Filter By Experiments With No Measurements. These shortcuts are provided to expedite the process of creating filters for the user; all can be made manually through the general filtering interface.