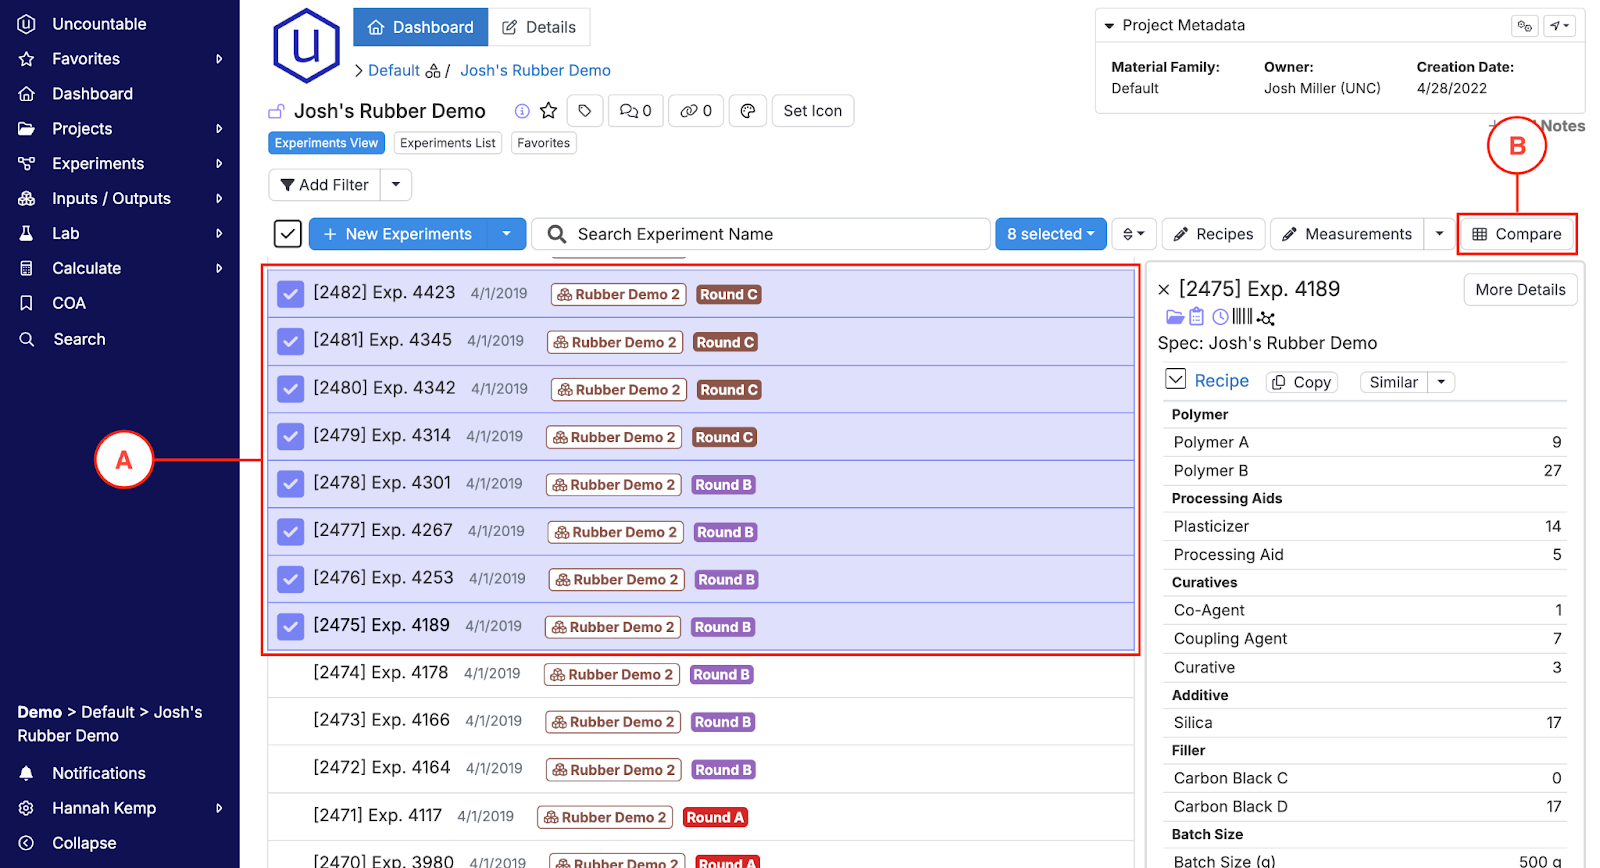
To compare experiments side by side in a tabular view, select the experiments from the dashboard that you’d like to compare (A) and then select Compare (B).
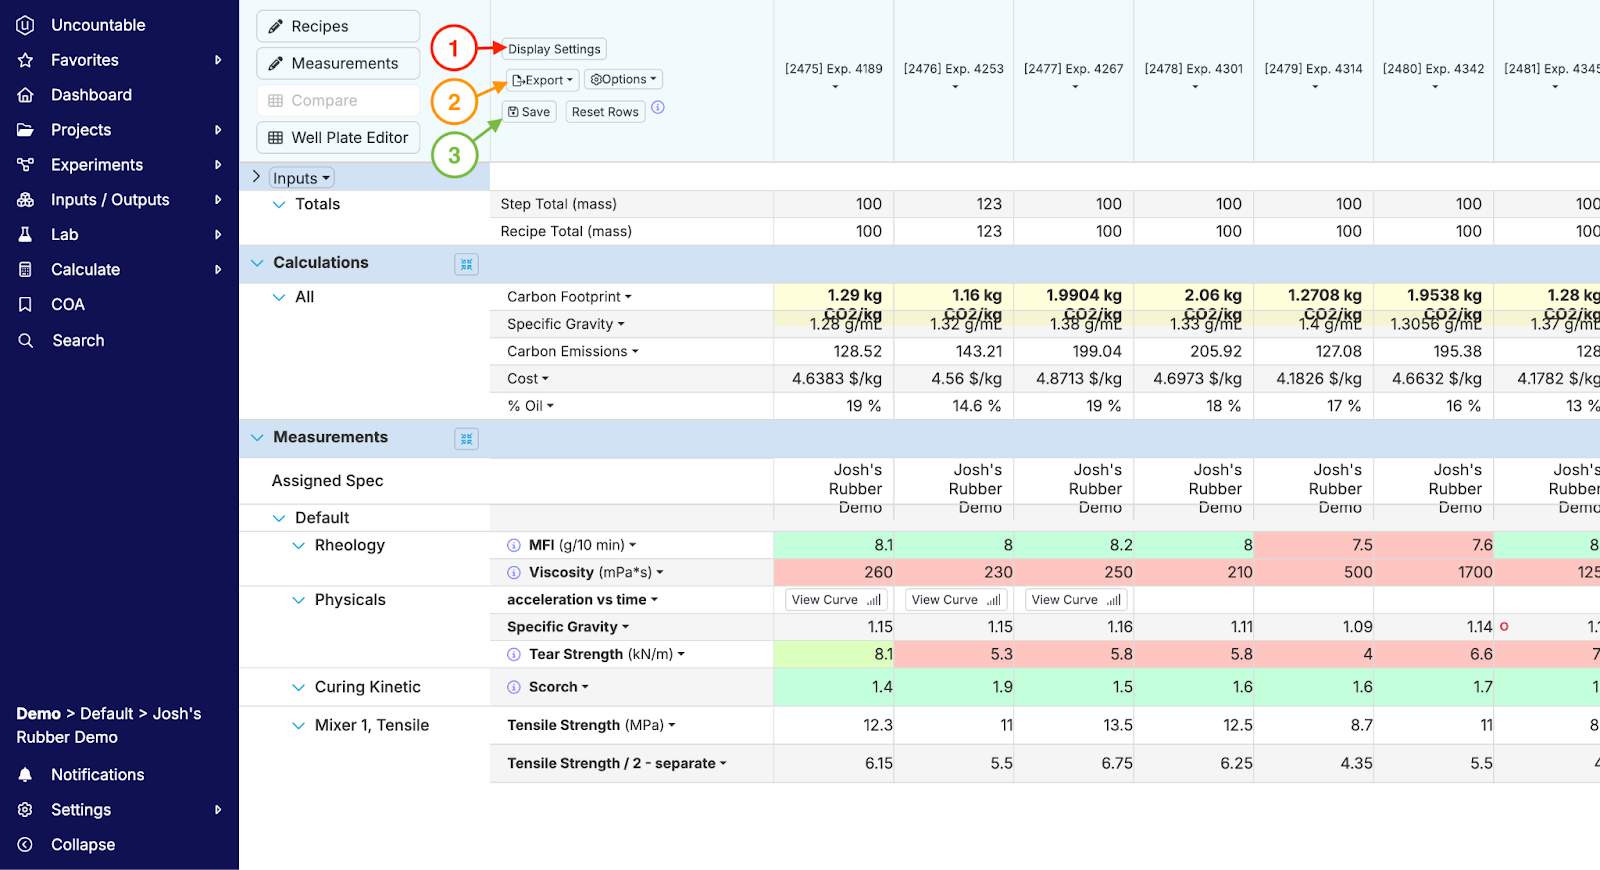
This will take you to the Compare View, which provides a concise, read-only display of all the information associated with the selected experiments. From this view, you can change the display of information (1), export the table to Excel (2), or save the table to a notebook (3).
Settings Options
There are many different tools available within the Options dropdown menu on the Compare page. These are described in order below.
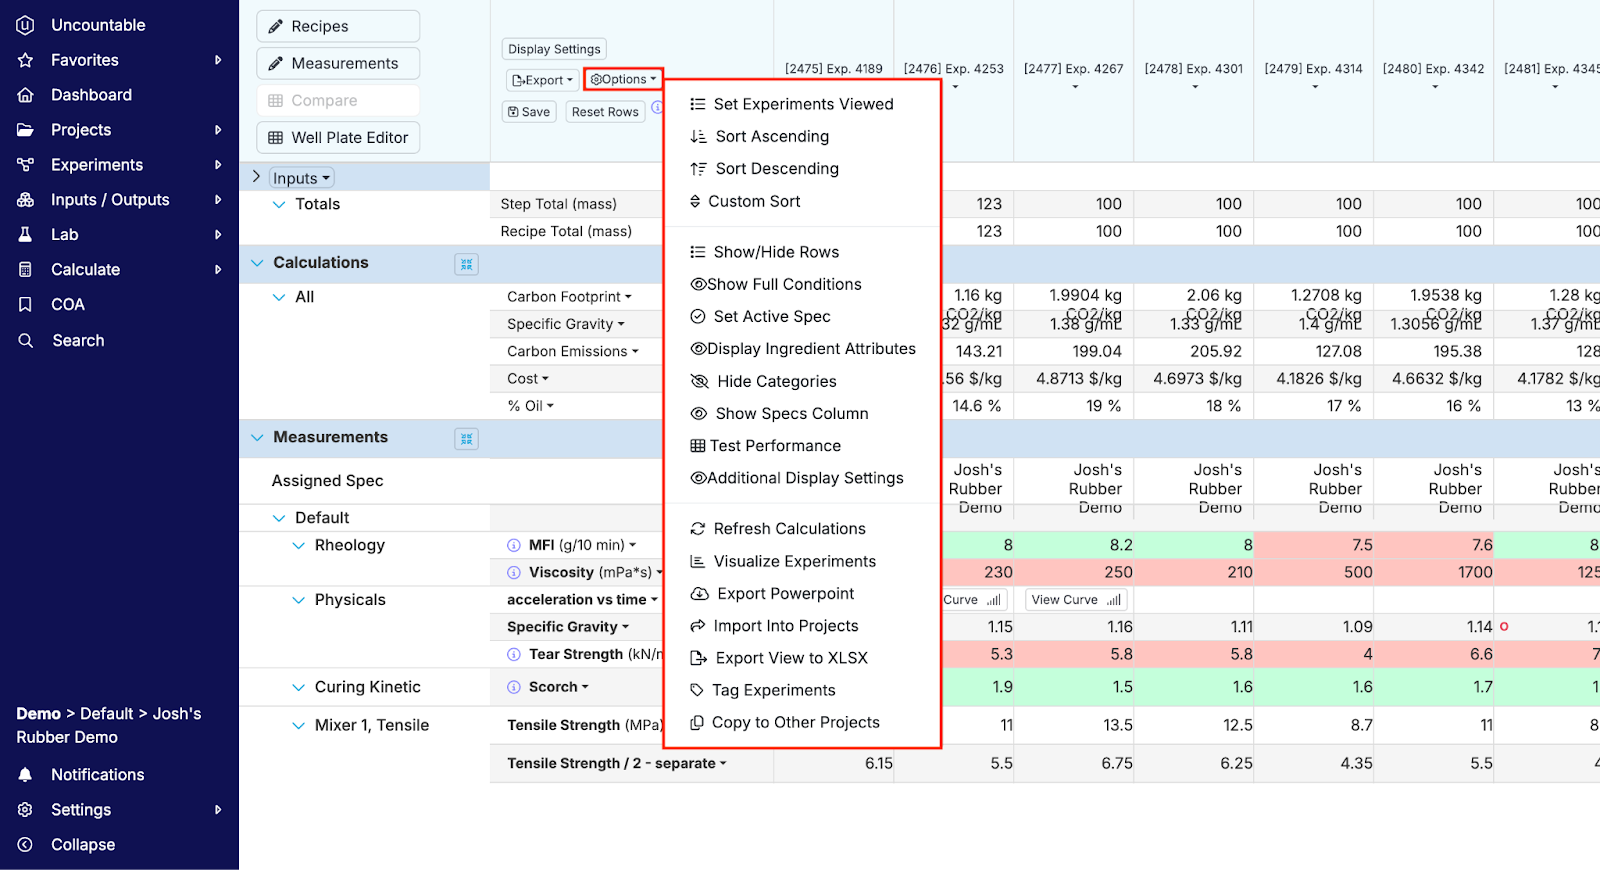
- Set Experiments Viewed: Allows you to change which experiments are displayed on the page
- Sort Ascending/Descending: Orders the experiments alphabetically in ascending or descending order
- Custom Sort: Allows you to manually sort the order of the experiments
- Show/Hide Rows: Allows you to select which experiment parameters you’d like to display in the compare table
- Show Full Conditions: Displays all condition parameters assigned to each output, including those set as table parameters on the recipe page
- Set Active Spec: Allows you to set a spec for the experiments in view
- Display Ingredient Attributes: Allows you to select ingredient attributes to include in the display as columns
- Hide Categories: Hides input and output categories from the display
- Show Specs Column: Displays a column with the spec details per output
- Test Performance: Takes you to the Test Performance page to evaluate the displayed experiments against spec
- Additional Display Settings: Provides the ability to further enable or hide information on replicates, mix steps, test samples, column calculations, actual values, and recipe notes, Compare vs Base Experiment, etc.
- Refresh Calculations: Refreshes and updates the calculations
- Visualize Experiments: Moves you to the explore data page filtered down to just the selected experiments
- Export to Powerpoint: Exports a clean table of the information displayed to Powerpoint
- Import into Projects: Allows you to import the selected experiments to another project
- Export View to XLSX: Exports the table of data to a data table in Excel
- Tag Experiments: Allows you to add tags to the selected experiments
- Copy to Other Projects: Copies the some or all of the experiment data into a separate project
Other Display Options
In addition to the display options available under the “Display Settings” tab, you can also perform actions on specific columns (experiments) or rows (inputs or outputs).
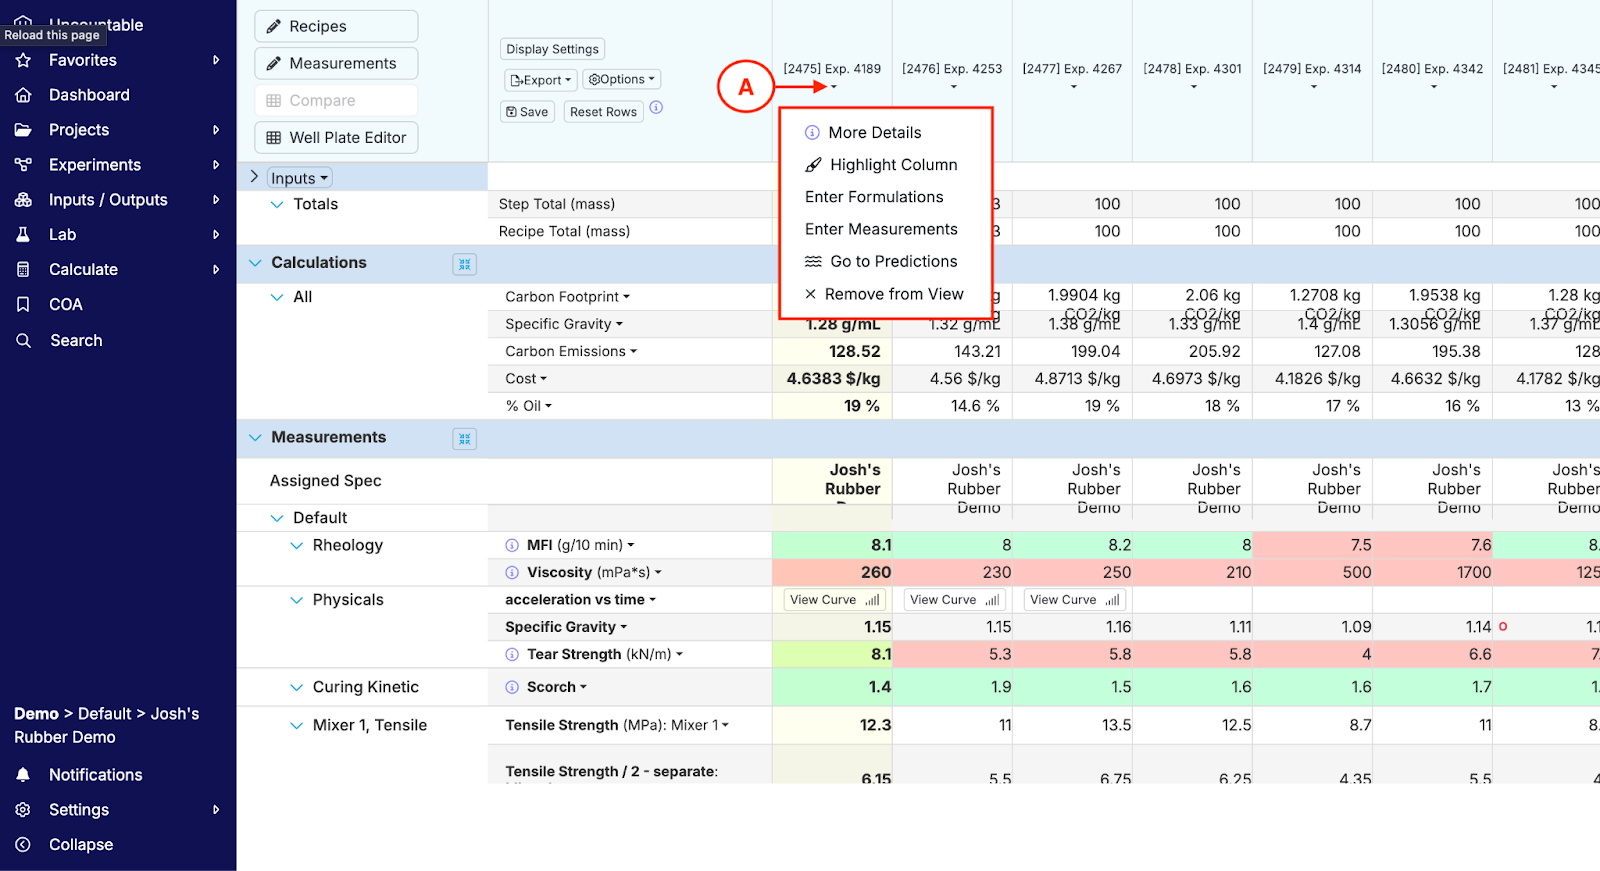
By clicking on the arrow beneath an experiment (A), you are provided a dropdown menu in which you can highlight the column to make it stand out, navigate to the enter Formulations, Measurements, or Predictions pages, and remove the experiment from the Compare display.
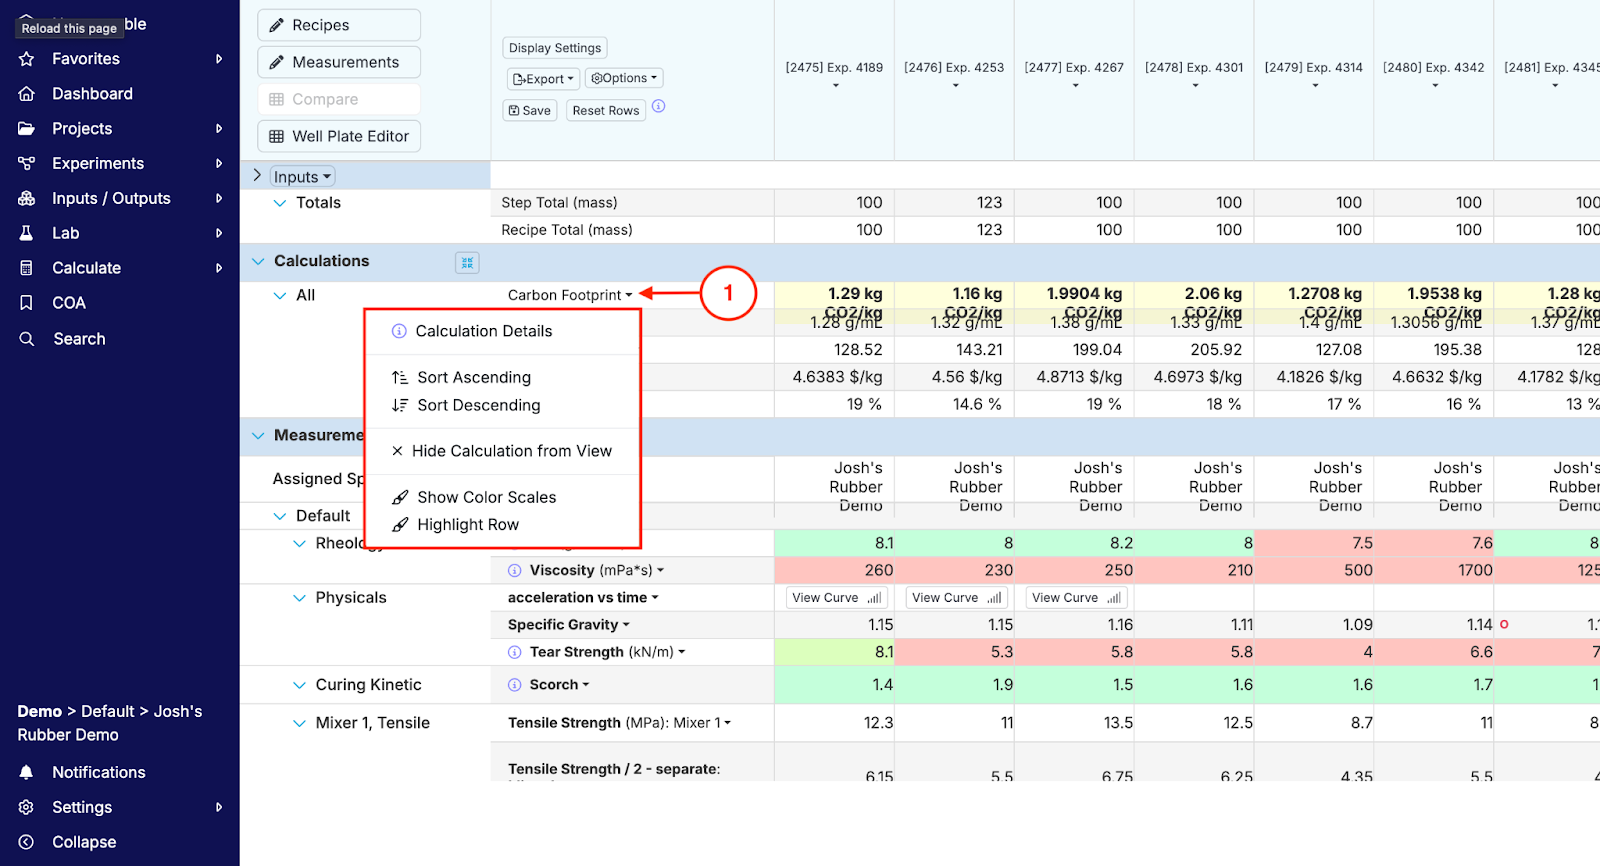
By clicking on the arrow next to an input or output (1), you are provided a dropdown menu in which you can you can sort the experiments in ascending or descending order based on the quantities for the selected entity, hide the entity from view in the compare table, and highlight or show color scales for the row.