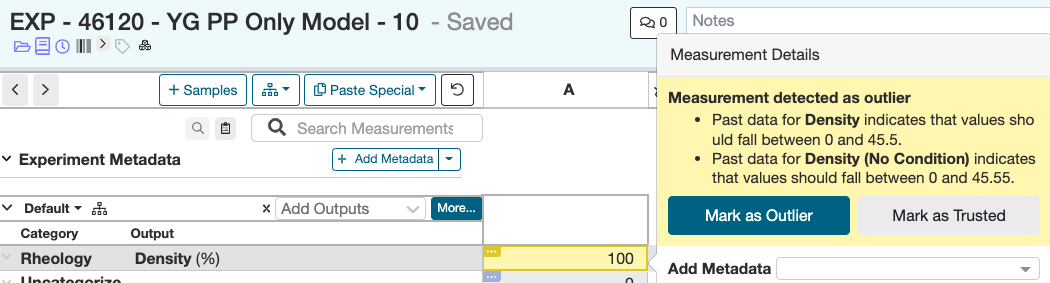
On the Measurements view of an experiment, we infer a “normal range” for outputs, and any value that falls outside this range will be automatically highlighted in yellow with a warning message on the page.
The normal range is calculated based on a few statistics derived from the output of interest (across all material families)*:
- 5th percentile (‘5pct’)
- 95th percentile (‘95pct’)
- Standard deviation (‘std’)
For the lower bound, we use the minimum of [5th percentile – 2std] and [5pct/2]. For the upper bound, we use the maximum of [95pct + 2std] and [95pct*5]. A rough equation is below:
Normal range = [min(5pct – 2 * std, 5pct/5), max(95pct + 2 * std, 95pct*5)]
Note that there are additional rules that apply under certain edge cases. We “snap” the values to 0 depending on the distribution. For example, if an output is always greater than 0, we will snap the lower bound to 0, even if the calculated lower bound is below 0.
Working Example:
- Assuming for output A. 5pct = 0.5, 95pct = 10, std = 10
- None of the recorded values are negative
- The inferred normal range would be roughly [0, 50]
* Detailed explanations of percentile and standard deviation can be found on Wikipedia.