The Explore Data page allows users to visualize many different types of Uncountable, including output metadata. For more information on output metadata, refer to Output Metadata.
Plotting and filtering by output metadata is particularly useful when you want to factor in background details (environmental factors, instruments used, tester, etc) into your visualization/analysis.
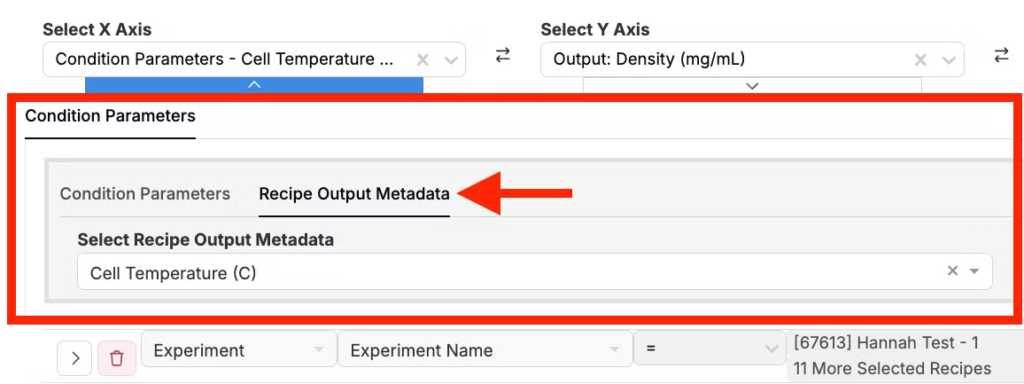
When adding output metadata into an Explore Data visualization, start by selecting “Condition Parameters” and then choose the relevant field from the “Recipe Output Metadata” tab. This is necessary because, similar to condition parameters, output metadata is supplementary information linked to individual measurements.
How to Plot/Filter by Output Metadata
1. Add Output Metadata to Measurements
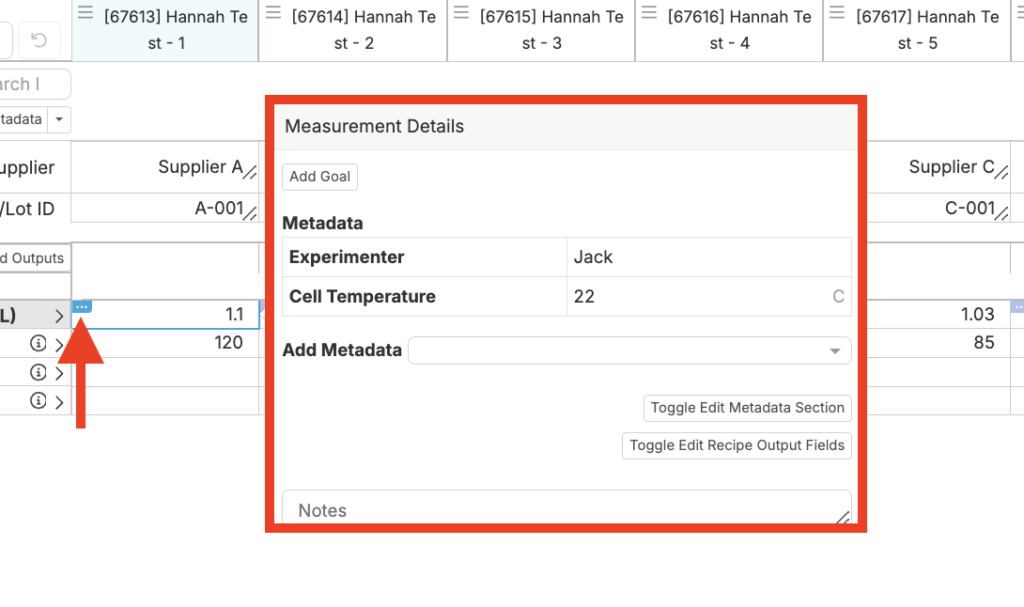
Ensure that each recipe includes relevant metadata fields. In this example, this includes Cell Temperature and Experimenter.
To add output metadata, select your experiments and navigate to the Measurements page. Hover your mouse over an output and click the “…” to open to Measurement Details. From there, select and enter output metadata.
2. Plot Output Metadata on the Explore Data Page
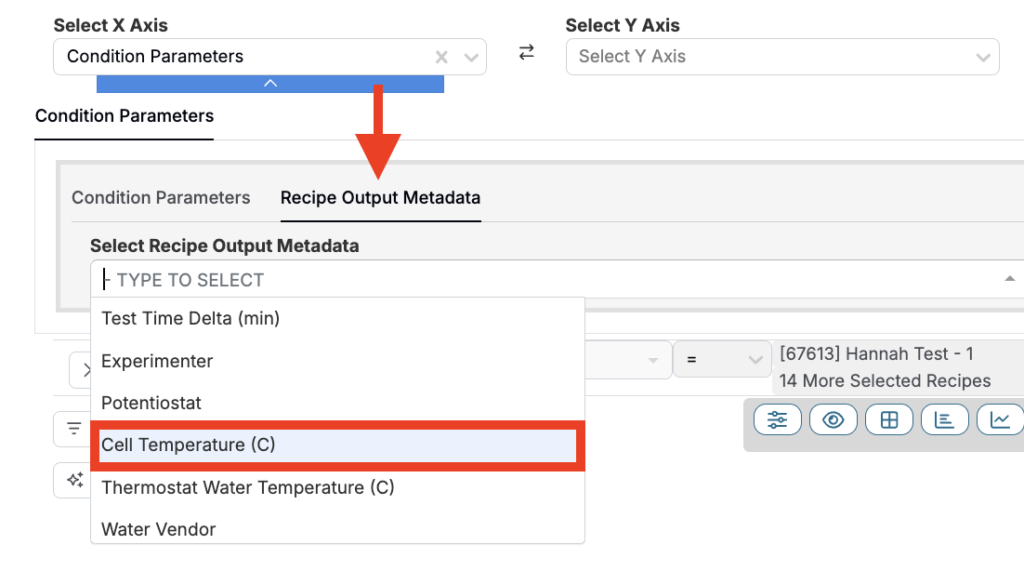
Next, select “Explore Data” from the top toolbar to navigate to the Explore Data page. Add output metadata by selecting “Condition Parameter”, which will display a new Condition Parameters window.

Select the “Recipe Output Metadata” tab, and choose the output metadata field from the dropdown menu.
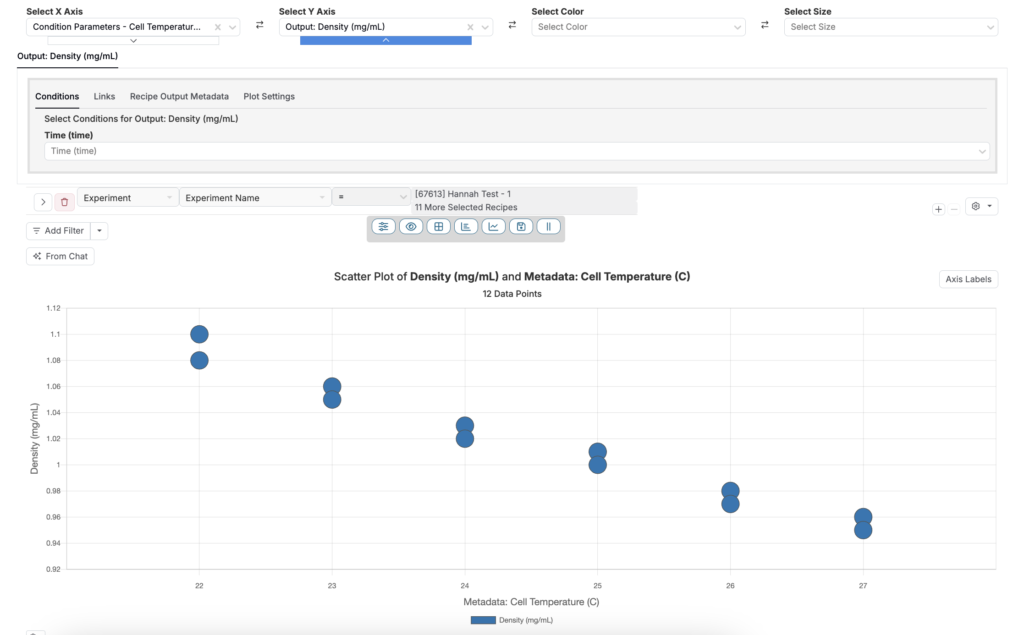
In this example, we will plot Cell Temperature (C) against Density (mg/mL). From this plot, can also add additional filters, colors, or sizes to the output metadata to assist with analysis.
3. Add Output Metadata Filters
To add an output metadata filter, click “Add Filter”.

Like before, first select “Condition Parameters” and choose your output metadata field from the dropdown menu under “Recipe Output Metadata”.
In this example, we will filter the plot to display only recipes with “Joe” as the Experimenter. The configuration (Condition Parameter + Experimenter + contains + Joe) and filtered plot are displayed below.

Adding this output metadata filter allows users to analyze only experiments run by a specific Experimenter.
4. Add Colors/Sizes to Output Metadata
Alternatively, you could associate output metadata with colors or sizes to distinguish between different metadata values.
To do so, use the “Select Color” or “Select Size” options at the top of the Explore Data page and repeat the same process as before. First, select “Condition Parameters”, then choose your output metadata field from the dropdown menu under “Recipe Output Metadata”.
In this example, we will use color to differentiate between experimenters. First, remove the output metadata filter. Then, use the Select Color dropdown menu and make the appropriate selections. The configuration (Condition Parameter + Experimenter) and resulting plot are displayed below.
Adding colors or sizes to output metadata values can be helpful in comparing measurements conducted under different conditions, by different researchers, etc.
Note: To use sizes instead, repeat the same process using the “Select Size” dropdown menu.
