1) How does Uncountable build their models?
2) What is uncertainty in the context of Machine Learning models?
3) How does Uncountable balance the exploration vs optimization?
4) How does the Uncountable algorithm look in practice?
6) How does Uncountable make sure that the models generalize to unseen data? (What is overfitting?)
7) How does overfitting look in practice? How do different algorithms generalize differently?
8) Is only one model trained for all outputs?
9) How specific can the model be for such a diverse formulation landscape?
11) Do you use domain adaptation techniques for all the data set, or for category sets?
16) How far are there linear and other relations among the data considered in the model?
21) In the spec, what is the difference between the “Lower/Upper Limit” and the “Goal” of an output?
22) How could one also include classification task in the platform?
23) How can a time series data set be integrated?
24) How will it be with other time series data?
25) How can we add our own models?. 11
27) Why are predicted outputs off?
28) How are confidence intervals constructed?/ Why are confidence intervals so large?
31) How much data is needed to have good predictions?
32) How can we then use the models for predictions?
1) How does Uncountable build their models?
We rely on an algorithm built on Gaussian Processes because:
- it fits a curve to the data and provides a function of certainty that is also informed by the data
- it takes into consideration the distance in between the available data points as well as the noise and translates that into certainty (where we have denser data, we tend to have high certainty)
- it is an algorithm suitable for “small data” given that it imposes very few assumptions
- allows the possibility to incorporate previous knowledge or beliefs
- it is capable of extrapolating outside of the range of the available data
- it is a conservative model, which will regress to the mean for faraway datapoints
See 4) for an example.
2) What is uncertainty in the context of Machine Learning models?
Uncertainty is a measurement of reliability of a model. A model tends to have lower uncertainty in areas where there are many data points and higher uncertainty in areas with few or no data points. This measurement depends on internal parameters of the model that control how smooth it is as well as how we penalize certainty as we move further away from the data. It is important to note that uncertainty only makes sense as relative values within a given model. Comparing uncertainties across models on a 1-to-1 basis does not necessarily hold as internal parameters can change.
3) How does Uncountable balance the exploration vs optimization?
In general, the design of experiments implies two competing goals:
- Exploration: Searching through unknown parts of a material design space to illuminate and model it. Important at earlier stages of a project.
- Exploitation: Searching through promising parts of a material design space, to search with some probability for an ideal solution. Important at later stages of a project.
It is not possible to have both at the same time. For example, an optimal experiment may have quantity x of ingredient A. Then, the next optimal ingredient may include ingredient A in a quantity x + ε, where we assume ε is very small. The next recipe in order of performance may have another difference of ε. You can then have any number of great-performing recipes but implementing all of them implies almost no exploration was done.
Balancing between exploration and exploitation speeds up development time, without needing to do too many fixed (factorial) DOEs. The Uncountable platform and algorithms make sure to provide promising formulations that are a) close to the minima or maxima given by a model trained on relevant data and b) varying in (many) directions where the most information will be gained, often across all ingredients.
The suggestions are presented in a specific order such that, when implemented in batch, the next iteration of the model will improve where needed. This procedure ultimately removes redundancy and drastically reduces the number of experiments needed to reach a certain set of specifications. See 4)
4) How does the Uncountable algorithm look in practice?
As an example, imagine we are trying to optimize the Strength of a material via adjusting two inputs: Time and Temperature. Imagine there is a real theoretical function that looks like this:
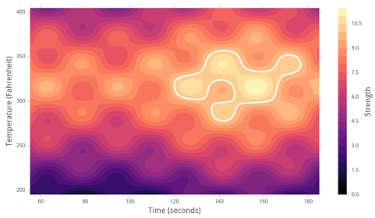
Ultimately, we want to find the optimal (highest) Strength -marked in white- at around Temperature=300F and Time=160s. We want to do so in an efficient way.
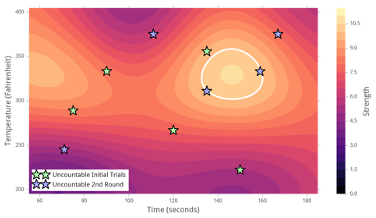
We first run the “Learn About Inputs” algorithm to generate 5 points – seen below as green stars – varying across all dimensions (inputs). After receiving results, we run the “Suggest” tool to feed data into the model, seen in the heatmap below, which fits a curve to the green points to refine and improve predictions. (Note how the hotspot coincides with that of the true function.) The sampling algorithm is run on top of the model to get 5 new points -seen in blue- that are close to the maximum and/or far from existing data.
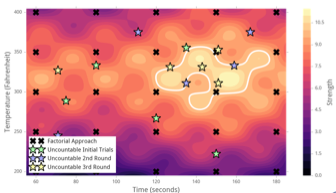
The next iteration of the model would take advantage of the two samples on the white ring to interpolate between them and suggest a recipe -seen as the black star- with the optimum performance.
If we, by contrast, took a factorial approach (seen below marked with black Xs) with a delta of 30s for the Time and 50 degrees for the Temperature, then we would end up testing 25 formulations. In the end, with the Uncountable approach, after 3 rounds and only 15 recipes we’d reach optimal strength.
5) Why doesn’t error (RMSE) decrease in later iterations of the model? / Why doesn’t accuracy increase with more data?
The RMSE (Root Mean Square Error) calculates how far the data points are from the fitted curve (i.e., the model itself). A model with RMSE=0 would be one that goes through all existing datapoints. A mathematical function with perfect accuracy in past data will most likely fail in future data; this is what is meant by overfitting.
On the other hand, a model that is able to produce smooth surfaces where there is noise and extrapolate reasonably well outside of the area where data points live is said to generalize well. In other words, we aim to produce the most useful model to understand current and future data, which is not necessarily the one with the lowest error.
Additionally, when there are outputs that are consistently noisy, the error metrics of the model will hit a limit irrespective of any new data.
6) How does Uncountable make sure that the models generalize to unseen data? (What is overfitting?)
In order to assess that our model generalizes well, we use a standard technique known as Cross-Validation (CV). This process consists in dividing the dataset into n subsets. We then train the model on n-1 of those subsets and evaluate on the remaining set. We repeat the process n times and average the results. We select the model that performs the best conditioned on carefully selected predictors and parameters. This means that, as mentioned above, selecting the model with the lowest RMSE only makes sense after we constrain the model to certain predictors, a reasonable range of the model parameters, extracted features, etc. Please see 7).
7) How does overfitting look in practice? How do different algorithms generalize differently?
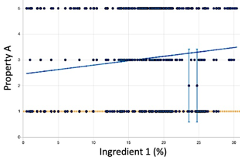
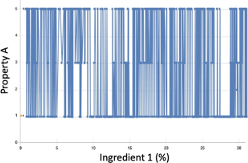
A model tries to fit a function to the training data. In the images below we analyze how different models map the input “Ingredient 1” to a discrete output “Property A”, such as a grading scale.
- Linear Regression: The first image shows the real data points as dots and shows a diagonal line corresponding to a linear fit. It is important to notice that there are many different Y values for a given x. This is due to several contributions -other ingredients and noise- to the variation in Property A. A simple linear regression may correctly identify the overall trend, but does not give any information about variation, non-linear effects or local minima.
- Extreme overfitting and no error: The second image attempts to join all points as if Ingredient 1 was the sole explanation for a change in the Property A. This is an extreme case of a model that has an error (RMSE) of 0 because it traverses through all points. We cannot expect such a model to perform well in future untested recipes. This model shows extreme overfitting and poor generalization capabilities.
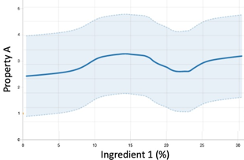
- Local Regression: This is a line plot produced in the Visualize Data page that uses a localized version of a regression algorithm to smooth out the data. It shows the confidence interval in lighter blue color which is a representation of noise. We see a slight general trend and faintly discerned local minima/maxima. We expect the RMSE to be high but will generalize better than a) and b).
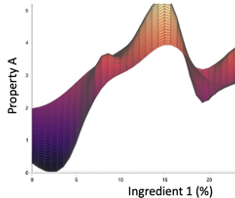
- Gaussian Processes: This is a 3D plot of the model produced with Uncountable ML algorithms. Note that we rotate the graph such that a second input is orthogonal to x and Y. (This second input explains why the model is not a line but has a thickness.) We see that this model correctly incorporates the stronger trend that a linear regression is able to pick-up, as well as the fluctuations seen when we average the noise in Y as well as clearly defined maxima/minima. On top of this, our ML algorithms are able to produce a second 3D plot to visualize the uncertainty. (For an output as noisy as Property A, the resulting uncertainty is constant, so we do not show it here.)
a)
b)
c)
d)
Models such as the one shown in b) can be achieved with a polynomial regression or an ensemble of many mathematical functions “trained” to obtain the minimum RMSE which produce plots that vary strongly in Y for very small changes in x. Such models are not very useful to us because:
- it assumes there is no noise and all variance can be explained by the structured inputs, which is unrealistic
- it does not define a trend that can be exploited in the future
- it does not provide any information on how reliable the information is for a given region (i.e., certainty).
8) Is only one model trained for all outputs?
Colloquially, we say there is a model for a certain spec when we click on Analyze or Suggest. In reality, we generate a collection of individual models; one for each of the different outputs in the spec. They interact indirectly in that they share the same predictors and hyperparameters. They interact strongly when getting suggestions in the form of a joint objective function used to optimize all outputs together.
9) How specific can the model be for such a diverse formulation landscape?
A single model, in theory, can learn all intricate relationships in order to generalize to diverse situations. This depends on the diversity, quantity and quality of data; but given that either subset of the three is often limited, it is recommended to train specialized models if we know a priori that performance for an output is strongly dependent on some parameter.
10) How can we ensure that we included the appropriate training set (all data, selected data) and all relevant predictors in a constraint set?
There is a trade-off between human time and quality of results. The more time spent in curating the data (and predictors), the better the results will be and the faster we will reach the goal. However, our systems are designed so that the automated selection of constraints and recommendations will eventually reach the goal, still saving time and number of experiments compared to the classical approach. The sweet spot of time saved vs timed spent is via encoding the learnings and expertise of scientists in the constraints and creation of archetypical training datasets for the different applications, which we only need to do once. To service this, we have two ways of selecting the data for training a model, both which are very interconnected to the predictors in a constraint set:
- Automated selection of inputs: several heuristics are applied to select the most relevant predictors. For example, we look at recipes with measurements for the relevant outputs in the spec, then we take all of the ingredients and parameters in those recipes and retain those that are present enough times and with enough variation and narrow down the training set accordingly. Recipes are merged based on predictors.
- Manual selection of inputs: That includes weeding out unnecessary ingredients as predictors, extending features via calculation building (making sure that the relevant ingredients do have the associated required attributes), narrowing down to a certain group (i.e. type of product, project) when necessary, etc.
11) Do you use domain adaptation techniques for all the data set, or for category sets?
In the automated selection, we make sure that the model learns from the most relevant predictors including categorical parameters. As mentioned in 10), careful analysis will disclose if it is better to build a separate model (by separating the training sets) for a given cluster of recipes (e.g., by Project, Type of Product, etc.).
12) How can the model also learn on its own what are the relevant parameters? How can we use transfer learning techniques to constrain the parameters space?
See 9), 10) and 11). In this context, transfer learning implies encoding knowledge in the constraints (predictors, calculations) and training set after analysis. We want to have the suggestions based on the ingredients available not on the pre-defined category.
13) How can we use all the ingredients as input parameters to generate new suggestions and not only the ones on the pre-defined category?
The platform works as described, in that the suggestion algorithms look at those recipes with measurements for goals in the spec and identifies the ingredients relevant to those goals in order to select predictors and the training set.
In some cases, limiting a training set to a single subset of recipes might be helpful. But the more general approach is to identify what general group of -or combination of- inputs characterizes a product. By adding those in a constraint set as predictors (even if they are never used in the suggestions), we expect a better model for recommendations.
14) From our understanding every ingredient has a goal-impact profile (certain ingredients affect specific properties). How is this implemented into the model?
Models trained on recipe-information only are “blind” in that they only see labels (ingredients) and values (percentage quantities). Models are unable to understand the identity of an ingredient by itself. That is why we cluster them together in Categories and make sure to incorporate their individual characteristics (attributes) via calculations (e.g., like cost), so that they directly influence suggestions/constraints. There are no “inferences” because it is something you can calculate directly, like stoichiometry.
15) Do you calculate a feature importance of the characteristics of each ingredient for the suggestions? If yes, is it possible to have access to it?
Yes, a ranking (or weight) of the features with respect to each of the outputs is available in the form of the Effect Sizes table after running an Analyze or Suggest job.
16) How far are there linear and other relations among the data considered in the model?
A Gaussian Process, the core modeling technique used by Uncountable, is capable of understanding complex non-linear relationships, but wants to favor simpler (i.e., linear) models when appropriate. So, if the data is truly linear, the system doesn’t want to add unnecessary complexity. In that way, linear models are always “considered”.
17) What would happen if we would add more describing parameters to the raw materials (e.g., physicochemical properties) would it help or would it lead to over-parameterization?
Over-parameterization is most likely not a concern given the typical data scales (e.g., few data points and many different ingredients). However, they most likely are “more helpful” when the project is focused on ingredients that are less commonly used (e.g., new screenings, ingredient swap). See 14)
18) Currently, the relations are extracted manually by data analysis. What will be the strategy to integrate completely new parameters?
The automatic selection of calculations is necessary because we need to make sure that all relevant predictors have the associated attribute values; otherwise, we would be introducing noise to the model. However, it is always possible to add all calculations in a constraint set, but select Auto on the Predictor columns so as to let the platform automatically select the relevant ones given the spec.
19) Why is the current model limited to max. 40 variable ingredients? what is the limitation there? What does this mean for our predictions? How can this be solved?
A model is not limited in the number of predictors; it can incorporate as many predictors (ingredients, parameters, categories and calculations) as necessary. This means it can generalize and predict on recipes whose union of ingredients exceed 40.
Only the sampling algorithms are limited to 40 (varying) ingredients/parameters since optimizing for that many inputs at the same time “does not make sense” given that the space is too large. This can be thought of in the following example: it is much easier to find a needle on the floor (2D) than it is to find it in a haystack (3D). Now imagine we add another dimension in the form of rooms that contain haystacks. If we have n rooms, the problem is n times harder. But in reality, we only have one extra dimension (rooms). Increasing the space by only one dimension makes the problem n times worse. In the literature, this is known as the curse of dimensionality.
20) It is unclear to me if a certain property, like Temperature, should be an input or an output. How can I conceptually differentiate between inputs and outputs?
The easiest way to assess it is to ask, can you directly control it?
- Yes, I can directly control the value (e.g., setting the temperature of an oven,) then it is an input.
- No, I cannot directly control it, but I may be able to influence it (e.g., measuring the temperature of a cake after being in the oven): then it is an output.
In some cases, outputs can affect other outputs because they are, for example, intermediate estimates or partially controllable. These should be treated as outputs, which can also be manually incorporated as predictors.
21) In the spec, what is the difference between the “Lower/Upper Limit” and the “Goal” of an output?
The limits are intended as the minimally accepted value. For example, if the output in question is set to Maximize, then the Lower Limit implies the minimum value to be considered as a success.
The Goal can be left empty as long as the corresponding Limit is set. In that case, the Goal will be inferred as the Upper Limit + 1 Standard Deviation according to the distribution of the output if we want to maximize it. It will be set as the Lower Limit – 1 S.D. in case we want to minimize.
If an output is particularly important, input values such that the difference between the Limit and the Goal is less than 1 S.D.
22) How could one also include classification task in the platform?
You can also model categorical outputs via a classification task in the platform. Our classification model is based on random forest algorithms, which are suitable to create decision boundaries between classes.
A few steps to a build classification model:
Firstly, make sure the outputs you want the model to predict on are categorical variables. Secondly, under the spec type, you can choose one of the three options from the dropdown menu: Multiclass, Allowed Options or Disallowed Options. Multiclass will keep the outputs as they are. While allowed option and disallowed option will perform like a binary classification. Allowed option will convert the categories you select as “Pass” and the rest as “Fail” while disallowed option will convert the categories you select as “Fail” and the rest as “Pass”.
23) How can a time series data set be integrated?
Time series data are, by definition, not independent. This means that measurements at a given point in time depend on past measurements. Our algorithms can take this into account in that condition parameters are used as predictors. We often do not want to take this into account as averaging over a period of time often reduces noise considerably. In the future, it will be possible to add dependency by adding past measurements as predictors for a given time.
24) How will it be with other time series data?
All outputs can be made into time-series outputs via the use of condition parameters. When you use different CPs in Uncountable, the different measurements aren’t modeled together. See 23)
We also support convenient uploaders for time series and other curves which can be processed or aggregated automatically within the platform.
25) How can we add our own models?
This is possible. Please contact an Uncountable manager to get help on setting that up.
26) Context on Predicability
Here we address some questions related to predictions and optimization of properties. It is paramount to first discuss the difference between prediction and optimization as they are two different paradigms but are often wrongly used as synonyms.
First of all, both obtaining predictions and optimizing are core parts of the platform and tasked with state-of-the-art procedures. However, prediction is much harder than optimization. Fortunately, our focus usually is in the optimization of a recipe which implies figuring out the quantities and for what ingredients we get the best performance. This means that in performing optimization we are more worried about the inputs that maximize or minimize a property, irrespective of how close that output minimum or maximum is to the real-world values.
On the other hand, prediction implies making sure that both a) the minima and maxima are located in the right values for inputs, and b) that those minima and maxima correspond to the real-world values.
While optimization is focused on finding directionality, trends and relative ordering of performance, predicting entails all of the aforementioned and also involves having punctual estimates of the output values. However, to obtain accurate predictions we need to explain all variability which is often impossible. Please refer to 27) and 32) for details.
If any model is close to 100% accuracy, it is probably lying to you and will generalize poorly. Please refer to 5), 6) and 7) for an explanation on overfitting and generalization.
27) Why are predicted outputs off?
See 26). Some outputs may be well represented in data diversity and quantity, which are very important for obtaining high-accuracy predictions. However, this does not guarantee accurate predictions for all types of recipes.
Nonetheless, even if predictions are off, we are mostly worried about the relative ordering of performance of different recipes. As long as that ordering stays true, we can optimize effectively.
Trying to obtain the best model for prediction, does not necessarily mean it will be the most useful for optimization, that is why the models generated with the “Suggest tool” and “Analyze tool” are different, even if the same constraint set is used. We’ve experienced that often specializing the model and only introducing relevant predictors (ingredients to considered in a product) will produce the best recommendations.
In general, some of the reasons that could explain why predictions are off:
- Most often than not, measurements have an associated inherent variability in the form of noise due to uncontrollable factors. This means that even with a big and diverse data set the predictions will have a confidence interval that is proportional to the noise of the measurement.
- Available values for a given output may be too few. Take into consideration that the count of datapoints available for a measurement are conditioned on the inputs used as predictors. For example: inputs A, B and C are used as predictors to obtain recommendations, but there are no recipes in the training set with either of those ingredients that also have measurements for the desired output, then it will be impossible to model such output.
- Available values for a given output show little or no variability. This means that even when there are many measurements available for an output, if those measurements are the same or almost the same (standard deviation is close to 0), then it will not be possible to model the output. We need variability to distinguish the bad samples from the good ones and obtain directionality.
- Data is skewed to lower values (long-tailed distribution). In order to model it effectively and increase accuracy, we recommend using a logarithmic transformation so that the distribution resembles more a bell curve. This, however, amplifies uncertainty in prediction, particularly for high values, as we need to transform back to base scale.
Predicted recipes include completely new ingredients or are “far” from the training data causing predicted values to both a) regress to the mean and b) show large confidence intervals meaning that it is worth exploring. See 1) of the Trouble Shooting Guide. Predictions can be improved by incorporating information of what type of ingredient it is in the form of attributes. Make sure that the calculations dependent on those attributes are used as predictors for the model.
28) How are confidence intervals constructed?/ Why are confidence intervals so large?
We use 80 % confidence intervals on predictions. That means that there is a 80% probability that the mean will be within the confidence interval range.
When you are using the suggested tool, you are inherently trying to reach new goals/use new ingredients which you have not achieved/used before. As a result, this is going to stretch to new spaces. Depending on how the constraints and project spec are set up, the model may suggest quantities or combinations that are far from what has been done before. Thus, usually you would see high confidence intervals under suggested formulations.
To show a toy example below:
A model was trained on ingredients A to G and showed very good predictive accuracy. Now, you want to use ingredients H to K and replace ingredients A to G with H to K in your next round. Because the model has never seen ingredients H to K, it does not know how these new ingredients are going to perform. Thus, confidence intervals on those predictions are likely be higher than what you have seen in the past.
29) When should I say the model has bad predictive accuracy and what to do next when you see bad predictive accuracy?
Two common metrics we use follow to define if the model has bad predictive accuracy or not:
1. How many data points are there in the model? Assuming I have X variables in the model, it is rare to see a model with less than 2X datapoints to have high/reliable predictive accuracy. In general, higher number of data points can lead us to a more reliable/robust model.
2. How does the explained error% look like (under the training accuracy table)?
Explained Error % (calculated using 1-RMSE/sigma) is based on root mean squared error (RMSE) in the prediction to the true standard deviation of that output.
This metric tells us how much variance in the output can be explained by the model.
100% means predicting outputs perfectly and 0% means no predictive accuracy.
When looking at this metric, usually, anything below 20% is low/no predictive accuracy (one should not trust the model on that output/predictions). Things in between 20-50% is showing some predictive accuracy and anything above 50% is great predictive accuracy.
What you could do when you see low predictive accuracy:
One of the first questions we usually ask our customers when we see lower accuracy is that: is this output truly important at this stage?
Assuming we included both elongation and modulus in the project spec and get good accuracy on modulus, but bad accuracy on elongation. Maybe the current priority is to improve modulus and most of the elongation is within the desired range. Thus, I might be able to set spec type as ignore for elongation at this stage. The reality is that assuming the elongation has a predictive accuracy of 20% (using 10 data points/experiments), it might require another 10-20 experiments to improve the accuracy to 40%. Is it worth the time/effort to add more experiments at this stage?
This is especially important thing to keep in mind If you have a lot of outputs in your spec. It is no surprise that a certain fraction of the outputs might not have high predictive accuracy.
Now, assuming this output is important and I cannot set its spec type as ignore:
- Is this output subjective? If yes, is there a way to work around it using another output as a proxy? The outputs like rating score is a good example. Usually, rating score is subjective. Regardless which model we use, it will have a hard time predicting pass or fail or rating from 0 to 5. However, maybe we can introduce another output to the model (E.g. assuming we derive this rate score from the strength measurement). The model might have better accuracy on the strength measurement since that is something measured from the instrument rather than a score.
- Some outputs have large batch to batch variance (E.g. if you run the exact same experiment over and over again, you get different results (meaning large variance) every time). If that is the case, we usually advise to run a parallel control with each batches and then normalize other values by each batch’s control. Those type of outputs usually would have relative lower predictive accuracy by natural and it would be hard to improve the predictive accuracy.
- Are there outliers present in the dataset? If so, we should exclude those and run the model again. We do have an outlier detection algorithm running on the backend. But sometimes, the outlier detection function might not catch all outliers present in the dataset (the outlier detection algorithm is designed more towards only tagging data which are outliers for sure, rather than tagging all possible outliers as outliers). A few extreme outliers (even only 5% of them) could really drive down the predictive accuracy.
- Are there additional predictors we can add to the model? Assuming we are interested in predicting viscosity and rheological modifier plays an essential role in predicting viscosity. Maybe the model did not include this rheological modifier for some reason. Thus, viscosity might suffer from a bad predictive accuracy. You can manually turn on an ingredient or ingredient category through the project constraint page. Advanced calculations (such as calculated Tg) can also be added into a model to improve predictive accuracy.
- Can we do some transformation on the output? Viscosity is a good example here again. Usually we model viscosity on a log scale since that usually tempts to give us higher accuracy.
In the end, we understand there is no “one size fits all”. If the default model (Gaussian Process) is not working as you expected and you want to try out other models, we offer linear regression, ridge regression, XGBootst, Random Forest on our platform as well. Comparing different models and finally pick the one that matches best to your priority/interest is another option here.
30) Tips on combining different datasets to train a bigger model and eventually use the bigger model for predictions/suggestions?
Firstly, a model with more data does not necessarily mean it would be a model with higher predictive accuracy/explained error. Via introducing more data into the model, one could potentially have a more robust model (basically a model which has seen more data and knows more about the ingredient space). On the other hand, this model can be exposed to more variance (such as variations between different ingredients/lots/batches, different labs, different locations, different instruments …) thus might not have higher predictive accuracy.
Secondly, before we combine different datasets, a few things we need to check (or ask ourselves: should we even combine those datasets?).
Do those projects share the same outputs you care about? Are those outputs under the same unit?
Do those projects share some common inputs which I want the model to learn from?
Are those projects under the same unit? (E.g. all projects under parts or percentage unit)
Are those projects under the same workflow? (Main workflow? Multi steps workflow?)
31) How much data is needed to have good predictions?
See 26) and 27). An output with great accuracy will have an explained error higher than 40%. This is extremely promising for optimization, even if not for prediction. In order to obtain accurate punctual predictions, we would need accuracies higher than 90%, which is unrealistic as accuracy usually increases logarithmically with the amount of data (an increase of 15 points from 55 to 70 may require twice the amount of data, which are not necessarily needed for optimizing).
It is important to notice that trying to improve accuracy just for the sake of achieving higher explained variability is not our goal. It is possible to obtain an explained error of 100% but such a model would be overfitting and generalize poorly, as explained in 6) and 7).
Please see 32) below to learn how to obtain predictions in the platform.
32) How can we then use the models for predictions?
It is possible to use a model to obtain predictions of past or new recipes. Please make sure that the model has been saved first:

After the model has been saved, there are two main ways to obtain predictions:
Go to Calculate -> View Model Surface where you can predict outputs for a theoretical recipe after adding ingredients and quantities or import an existing formulation which can also be modified.

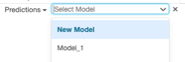
Select recipes in the Dashboard that you want to predict on and click Edit Recipes. Make sure that the desired model was saved and that, in the Display tab, Predictions are shown (see image below):

Then, at the bottom of the page, you will be able to select a model and see the predictions for the recipes in this view:
Note that our models excel in finding trends and ranking recipes according to performance, so it makes sense to look at the relative ordering when looking at predictions. Obtaining punctual predictions for single recipes is extremely hard, as explained in the questions above; fortunately, predictions do make sense in the context of a population. This means that predictions of performance of untested recipes can be compared to one another to identify meaningful differences and manage expectations.
In other words, the intended use of the predictions presented along suggestions is to show relative order of performance and understand which formulations are more exploratory, indicated by large confidence intervals.